The San Francisco Bay Area (home of the San Francisco and San Jose metropolitan areas), which has often been cited as a place where natural barriers have left little land for development. This is an impression easily obtained observing the fairly narrow strips of urbanization on both sides of San Francisco Bay, hemmed in by hills.
However the Bay Area’s urbanization long ago leapt over the most important water bodies and then the Berkeley Hills to the east. Not only is the San Francisco Bay Area CSA high density, but it is also spatially small. In 2016, the San Francisco built-up urban area was only the 23rd largest in land area in the world. New York, the world's largest built-up urban area in geographical expanse is more than four times as large.
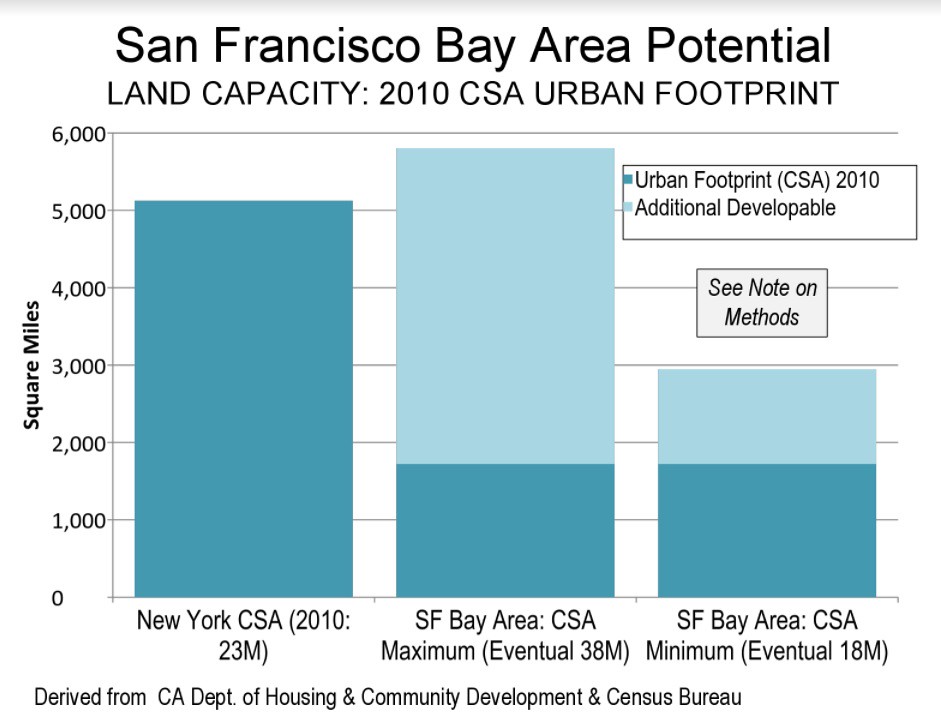
There is plenty of developable land in the San Francisco Bay Area. Data in a 1997 state analysis indicated that another 1,500 to 4,300 square miles (3,900 to 11,000 square kilometers) could be developed in the Bay Area CSA. The lower bound assumed no farmland conversion and stringent environmental regulation. The report also found that in recent years, residential development had become marginally denser, yet not incompatible with the detached housing remains the preference in California (Figure). The state has more than enough developable land for future housing needs.

Updating the data to account for the development that occurred through 2010, the developable land supply could support an urbanization of between 18 million and 37 million population, well above the 2010 urban population (Note on Method). At the most, there is capacity to accommodate the population of Tokyo – Yokohama, the world’s largest urban area. At a minimum, use of the available land would catapult the Bay Area CSA ahead of the Los Angeles-Riverside CSA, more than double its present population.
Of course, the Bay Area is simply not growing fast enough to reach even the lower population figure any time soon. Even with its slower growth, however, the competitive market for land no longer works, in large measure because of land use regulation. The San Jose metropolitan area has the fifth worst housing affordability in the Demographia International Housing Affordability Survey with a median multiple of 9.6 (median house price divided by median household income) and the San Francisco metropolitan area is 7th worst, with a median multiple of 9.2. Before the evolution toward urban containment policies began, the median multiples in these metropolitan areas (and virtually all in the United States) were around 3.0 or less.
The decades old Bay Area housing affordability crisis, and that of other urban containment metropolitan areas that are now seriously unaffordable (median multiples over 5.0) seeking to force higher densities, is more the result of policy than nature.
Note on Method: Some of the CSA urban population is not in the continuous urbanization of San Francisco-San Jose built-up urban area, such as in the Santa Rosa, Stockton and Santa Cruz urban areas. This analysis is based on data from the California Department of Housing and Community Development and the U.S. Census Bureau. It is based on an estimate of additional development occurring from 1996 to 2010 and the land remaining after deduction of recently developed land. The population capacity assumes the “marginally higher” densities used by the California Department of Housing and Community Development, which it notes would not require substantial changes in the “current form of housing development” (1997).


