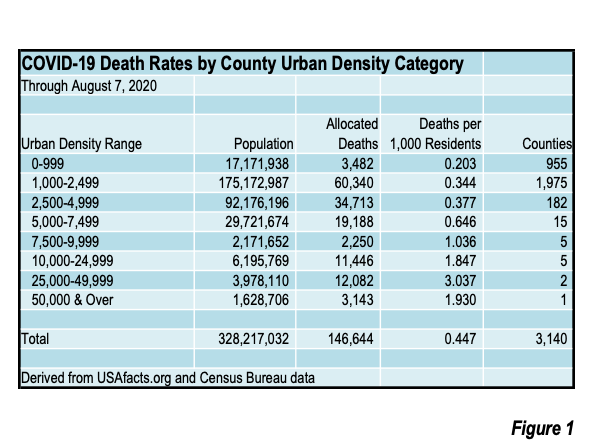
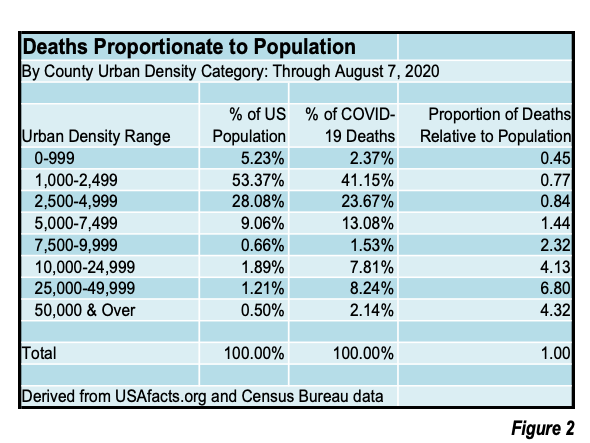
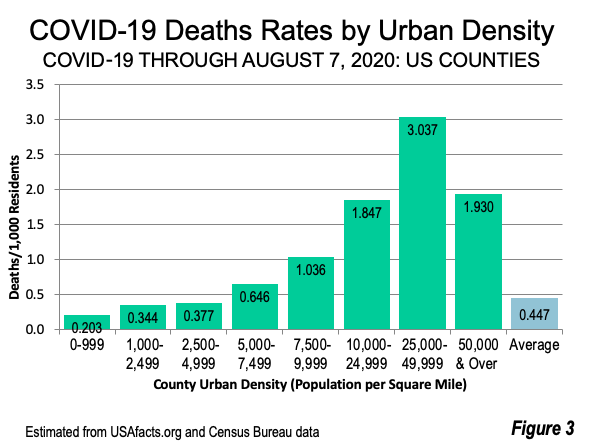
NewGeography.com blogs

Wind Energy is Not Just Hot Air

Anaheim Convention Center, Southern California, last week was a hot bed of one of the ultimate forms of renewable energy. The “fuel” used by wind turbines (really the wind) is free for the 30 year life span of the windmill installation, is considered inflation proof, and is 100 % domestically available.

Just a brief walk through the trade exhibition convinces any visitor of European as well as Chinese commitment to wind energy. One guest speaker, Ted Turner put it: “Just do not look at the next 30 years, look for at least a few hundred years of human energy needs.”

Conventional energy lobbyists claim that wind is unreliable and will harm operation of the grids. However, grid operators have observed that wind power is more reliable and predictable.

There are rumors that sound of operating wind will cause a variety of dangerous health effects, including headaches and disturbed sleep. The studies have shown that wind turbines at a distance of 2,000 feet (normal building codes for Wind Mills) have a dB rating close to 45 (comparing that to 55 in an average home in the USA). Normally, two people can carry on a conversation on any wind mill farm. Please remember: this energy source has no side effects such as air or water polluting emissions, no hazardous waste, and has a direct impact on reducing the public health impact of any other energy generation.

Are birds get affected by wind energy? A very legitimate question by the American Bird Conservancy needs to be addressed with honesty. The bird loss caused by buildings is about 550 million, by power lines 130 million, vehicles 80 million, poisoning by pesticide 67 million, and radio and TV towers close to 4 million. The tabulated loss by wind is under 150,000. Special attention is being paid to bats: The bats and wind energy coalition was formed in 2003 by Bat Conservation International, the U.S. Fish and wild life Service, and the National Renewable Energy Laboratory.
The view of a wind energy facility or the distance of a home from a wind mill farm had no consistent, measurable or significant impact on home values.

The current worldwide installed capacity gives a snap shot of Wind energy penetration in a given region. By 2010, the European Union was leading the world with 84,000 MW, China with 42,000 MW and the USA was at 40,000 MW. However, Denmark leads the world as percentage of total power needs fulfilled by Wind Energy: close to 20 % in 2010.

The potential of up to 20 % electricity generation that can be derived from Wind Energy is feasible, both technically as well as financially by 2030. Most land used to construct wind farms can be used for its original purpose of harvesting, grazing and farming. The actual foot print of turbine farms, roads and generating and transmitting facilities is under 3 percent of total land taken out of commission.

Wind Energy should be debated in the public forum with both energy independence and long term sustainability for our planet beyond the next election cycle.

Transportation Infrastructure: Yankee Ingenuity Keeps California Moving

A friend was explaining some philosophy to me the other day and he used an analogy to make his point: If you can get a cannibal to use a knife and fork, is that progress? Of course, the answer is "no". So when I heard the next day that transportation infrastructure performance in the US improved significantly at the height of the worst recession since the great depression I had to ask: is that progress?

We do not want to stop all economic progress just so that a privileged few with access to resources may enjoy an easier ride on the I-95 interstate highway between Wall Street and Congress. Stopping economic growth is not a solution to the problem of crumbling infrastructure in America.

In fact, my economic analysis shows that transportation infrastructure is a “leading indicator” of economic activity. In other words, infrastructure performance has to improve for a while – and stay improved – before economic activity will pick up in an area. Alternatively, infrastructure performance would have to decline for a while before businesses would leave that location, too. Think about it this way. From the perspective of a company already in business in a particular location, they would not pack up and leave town the first day that, for example, traffic congestion slows down the delivery of products to their customers. Companies like FedEx Freight plan distribution locations 20 years in advance. For a while, they will find a way around congestion. FedEx Freight uses elaborate technology to “route trucks around huge bottlenecks, but this adds circuitous miles and costs”. Their policy is to “minimize the impact as best you can.”

We see evidence of how business finds a way to make it work even when government and infrastructure try to stand in their way. California ranked 43rd in 1995 and fell further to 47th in 2000 and 2007 among the 50 states (plus D.C.) in the U.S. Chamber of Commerce’s transportation infrastructure performance index. Although California’s infrastructure is crumbling, businesses are finding a way to work around it. California’s economy could grow faster than the rest of the US economy this year.

In economics we talk about the efficient use of resources – getting the most out of what you have to work with. In a new study getting underway at the University of Delaware, early results indicate that businesses are operating successfully in the United States despite being hampered by problems like congestion and the lack of intermodal-connectivity (that is, being able to move products from trucks to trains and from trains to ships). California, in fact, may be a benchmark state for economic efficiency. They rank at the bottom for infrastructure performance but business is finding a way to make it work.

My old pal, Larry Summers – former Economic Advisor to President Obama and subverter of all things economic – took a last final swipe at spending on transportation infrastructure in April 2011. In his first public appearance at Harvard University after leaving the White House, he talked about investment in infrastructure as a way to “…tackle high levels of unemployment, especially among the low-skilled.” He just doesn’t get it. He continues to believe that the way to stimulate the economy is to give tax breaks to business – as if they will build their own roads. He just didn’t get that infrastructure is what supports all economic activity. It’s the stuff that business does business on, not the classical economic “capital” that business brings to the table.

In fact, it costs businesses to have to work around the crumbling infrastructure. When you ask academic, government and researchers to measure that cost, you get a wide range of views about what constitutes a direct or an indirect cost to business from traffic congestion. But some of these costs are undeniable. There is a cost of computer technology for monitoring congestion; the cost of employees for communicating with drivers about alternate routes; the cost of extra fuel; driver overtime resulting from congestion; refunds to customers for missing guaranteed delivery deadlines, etc. etc.

So, there’s a benefit to business from improving the performance of transportation infrastructure. They will be saving the money that they are spending now to work-around the infrastructure. And money not spent is at least as good as a tax break.

Disclosure: Dr. Trimbath’s research on the economic impact of transportation infrastructure performance was supported by the National Chamber Foundation and sponsored in part by FedEx Freight. The 2009 Transportation Performance Index will be released on July 19, 2011 in Washington, D.C. It will show a substantial improvement over 2008.

Fwd: California's Bullet Train --- On the Road to Bankruptcy

For California’s high-speed rail boosters including their chief cheerleader, U.S. Transportation Secretary Ray LaHood, the month of May must have felt like a month from hell. First came a scathing report by California legislature’s fiscal watchdog, the non-partisan Legislative Analyst’s Office (LAO), questioning the rail authority’s unrealistic cost estimates and its decision to build the first $5.5 billion segment in the sparsely populated Central Valley between Borden and Corcoran. That segment, the LAO noted, has no chance of operating without a huge public subsidy, yet the terms of the voter-approved Proposition 1A, explicitly prohibit any operating subsidies.

These concerns were echoed by an eight-member Independent Peer Review Group. "We believe the Authority is increasingly aware of the challenge of accurate cost estimating," wrote its chairman Will Kempton in a letter to the California High-Speed Rail Authority’s CEO, Roelef van Ark. The Legislative Analyst‘s Office had concluded that if the cost of building the entire Phase I system were to grow as much as the revised HSRA estimate for the Central Valley segment (an increase of 57%), the Phase I system would end up costing not $43 billion as originally estimated, but $67 billion.

The two reports unleashed a torrent of criticism from the press. In sharply critical editorials, The Wall Street Journal and the Los Angeles Times questioned the project’s fiscal viability and the Authority’s poor decisionmaking. The project is "a monument to the ways poor planning, management and political interference can screw up major public works," opined the LA Times. ("California’s High Speed Train Wreck," May 16). "If the state can’t come up with enough money to finish the route, a stand-alone segment in the Central Valley would literally be a train to nowhere and a big drain on taxpayers," said the Wall Street Journal ("California’s Next Train Wreck," May 18). "The legislature needs to kill the train now. Once this boondoggle gets out of the station, the state will be writing checks for decades," added the Journal in its most recent editorial ("Off the California Rails," May 30). The San Francisco Examiner and The Sacramento Bee also have been critical in their reporting. Governor Brown needs to "squarely address the issues raised by the legislative analyst’s report," a Sacramento Bee editorial urged.

Even some of the state’s former legislative supporters, such as state senators Joe Simitian, Alan Lowenthal, Anna Eshoo and Mark DeSaulnier have expressed reservations and urged the Authority to rethink its direction. "I don’t want to see an EIR (Environmental Impact Report) completed for a project that will never be built," Senator Joe Simitian told Roelef van Ark at a Senate Budget Subcommittee hearing on financing the first rail segment in the Central Valley.

At the urging of the Legislative Analyst’s Office, the rail authority asked the U.S. DOT for more flexibility about where and when to build the initial "operable" segment. The LAO went as far as recommending that "If the state can’t win a waiver from the federal government to loosen the rules and the timing for using high-speed rail grants, it should consider abandoning the project." Not only would the Central Valley segment, by itself, have insufficient ridership and revenues to stand on its own, the Legislative Analyst wrote, but "the assumption that construction of the Central Valley segment could move quickly because of a lack of public opposition has already proved to be unfounded." The LAO suggested several alternative segments that could be more financially viable and economically beneficial than the Central Valley segment. They included Los Angeles-Anaheim, San Francisco-San Jose and San Jose-Merced.

But in a remarkable exercise of inflexibility and delusion, the U.S. Department of Transportation turned a deaf ear to the request. "Once major construction is underway...the private sector will have compelling reasons to invest in further construction," the DOT letter stated in an assertion totally unsupported by any evidence.

"California is a test case for whether high-speed trains can succeed in the U.S. — and so far, the state is failing the test," the LA Times editorial concluded. The feds’ refusal to reconsider their position has substantially magnified and accelerated the likelihood of that failure.

LATE-BREAKING NEWS 6/6/2011: In the wake of the LAO report, both houses of the California Legislature have passed legislation that, in effect, is a vote of no confidence in the California High Speed Rail Authority (CHSRA) and its Board. The bills place the Authority within the state's Business, Transportation and Housing Agency, thus giving the Governor decisionmaking power over the project. The Senate bill would "vacate" the appointments of the current Board members and provide for the appointment of a new advisory Board with special expertise in construction management, infrastructure finance and operation of rail systems. The House bill would retain the current Board but only in an advisory capacity. The two bills will have to be reconciled before they are sent to the Governor for signature. However, with the bills sponsored by three Democrats, the Governor is expected to sign the final bill into law [SB 517 (A. Lowenthal), passed on June 1 by a vote of 26-12; AB 145 (Galgiani and B. Lowenthal) passed on June 3 by a vote of 50-16].

There is a possibility that a change of leadership at the Authority, coupled with mounting grassroots opposition in the Central Valley, might delay the project past September 2012 --- the federal deadline to start construction--- and thus disqualify the project from federal grant assistance extended under the stimulus (ARRA) legislation. The deadline was reaffirmed in a letter from U.S. DOT's Undersecretary for Policy, Roy Kienitz. "U.S. DOT has no administrative authority to change this deadline, and do not believe it is prudent to assume Congress will change it," Kienitz wrote to Roelof van Ark.

Federal Survey: Fewer Transit Commuters

Results from the US Department of Transportation's 2009 National Household Travel Survey indicate that transit's work trip market share in the United States was only 3.7 percent in 2009. This is a full one quarter less than the 5.0 percent reported by the Bureau of the Census American Community Survey for 2009. Further, the NHTS data does not include people who work at home. If the work at home share of employment from the American Community Survey is assumed, the transit work trip  market share would be 3.5 percent.

Much of the difference is due the differing questions asked in the two surveys. The American Community Survey asks how people "usually" got to work last week, while the National Household Travel Survey (NTHS) data is based upon actual diaries of travel kept by respondents. The NHTS reports that among people who respond that transit is their "usual mode" of travel to work, transit is used only 68 percent of the time. In contrast, the daily trip diaries report that commuters who drive alone are a larger share of the market than those who indicate driving alone as their usual mode of travel. People who report their usual mode as "car pool" actually use a car pool to get to work only 55 percent of the time, an even lower rate relative to "usual" mode than transit.

The daily trip diaries from the NHTS also a large difference in travel times between automobile commuters (including car pools) and transit. The average automobile commute time was 22.9 minutes, while the average transit commute time was more than double, at 53.0 minutes.

Understanding the Egyptian Protests: Headwaters of the Arab Spring

On Tuesday, January 25, 2011, the leaders of the Egyptian protest group, April 6 Youth Movement (A6Y), led hundreds of thousands of protesters chanting, “Bread, Freedom, Human Rights” into Cairo’s Tahrir Square. The events that followed completely surprised the economic elites gathering for the annual World Economic Forum meeting in Davos, Switzerland. Few put much stock in the importance of the actions of young people in Egypt until the protests overturned that country’s entrenched power structure in a matter of weeks.

Why were the leaders of the global economy so surprised by the events that have come to be known as the Arab Spring, and why did they feel so threatened by them? Why did the protester’s demands spread so quickly throughout the Arab world after decades of suppression by autocratic regimes? 

The answer to these questions lies in an understanding of the complex interaction between technological and generational change, fueled by a hunger for a better future, that continues to be the underlying source of the institutional instability and that will reshape the entire region. In a new Kindle Single, Headwaters of the Arab Spring, NDN fellows Morley Winograd and Mike Hais explain how these intertwined forces are destined to undermine institutions and leaders in every corner of the world.  

Planning Decisions Must be Based on Facts

While the misreporting of city population density comparisons commented on by  Wendell Cox was probably inadvertent, it is indicative of a general problem relating to contemporary planning – misrepresentation of facts.

We are repeatedly told of the wonderful results of infill high density policies in locations such as Portland, USA or Vancouver, Canada which on investigation are found to be non-existent or applicable only to a small locality instead of to the city as a whole.

Quantitative data is frequently misrepresented. To give one example, a 2008 Canadian study is often quoted as proving high-density reduces greenhouse gas emissions. Inspection and interpretation of the data provided reveals this to be negligible.  Without any evidence to the contrary, it seems reasonable to assume that the Canadian fraction of total household emissions that relate to transport is similar to that shown on the Australian Conservation Foundation's website, being 10.5%. Applying this value to the data in Chart 2 of this Canadian study one finds that for those living within 5 km of the city centre there would be a transport difference attributable to increased density of only 1% in total annual emissions per person. For people living 20 km or more from the city centre the difference would be much less at 0.2%.

We are told that high-density imposed on areas originally designed for low density is good for the environment; that it provides greater housing choice, that it reduces housing cost, that it encourages people on to public transport; that it leads to a reduction in motor vehicle use and that it saves on infrastructure costs for government. Not only do none of these claims stand up to scrutiny in any significant way, the contrary mostly prevails.

Movements advocating high-density show characteristics of an ideology, their members’ enthusiasm resulting in a less than objective approach. The desire by these individuals to be socially and environmentally responsible and to identify with a group marketing these imagined benefits is understandable. Some may even benefit professionally. However the result is policies for which no objective favorable justification can be provided and which are not wanted by the greater community who have to live with the consequences.

Hollywood Unions

If you work in L.A. in film, tv, radio, music, news, live or “new” media, there’s a very good chance you’re in a union.

That’s true if you’re an actor, camera operator, broadcaster, hair stylist, electrician, costume designer, truck driver, writer, production manager, art director or stunt man or woman.

It’s one of last industries in America with what’s called “union density,” in which collective bargaining determines wage scale, residuals, medical and pension coverage; and sets work rules and jurisdiction (who does what).

Some members earn a fortune, others a decent living, many barely – or don’t – get by.

I can’t think of another field, however, where people will pay to get into the union even before they have a chance to put their talent to work.

And though there’s a mixed historical legacy to the Hollywood labor movement – anti-communism, race and gender discrimination, corruption and complicity – these unions have mostly cleaned house, adapted to changing conditions, and (to varying degrees) have learned to organize new work.

Industry employers include some of the most powerful corporations on the planet. But despite intense fights over nonunion and “runaway” productions, you don’t hear talk about getting rid of the unions.

That’s partly because the unions help manage the “freelance” workforce. It’s also that powerful people in the industry – labor and management – accept the system, flaws and all.

More than 90 percent of private sector American workers are nonunion. For most, the idea of making their job union never crosses their mind.

But here in L.A., many workers know someone who’s “gotten in” to “the business” and one of its unions.

And, over the past 20 years, both “above and below the line” unions have integrated into the region’s labor movement, recognizing the value of solidarity in organizing and contract campaigns, politics and strikes.

It’s too bad most American workers – stuck in low wage jobs with marginal or no benefits – know virtually nothing about how this industry really operates; and – in particular – the role its unions play in sustaining the region’s middle class.

This is Not the Way to Fix Toronto's Transit

Results and not ideology should guide transportation policy.

Large city officials have been lobbying for a major program of federal transit subsidies for years. The push will likely intensify after the federal election.

A principal resource in this campaign will likely be the Toronto Board of Trade’s third annual Scorecard on Prosperity, which finds Toronto’s transportation system to be among the worst in the world, ranking 19th out of 23 metropolitan areas. Other metropolitan areas also ranked poorly, such as Montreal at 12th, Calgary at 13th and Vancouver at 21st.

However, a deeper look yields difficulties with the Board of Trade report.

Automobiles dominate travel in all but two of the metropolitan areas (Hong Kong and Tokyo). Yet, only two of 11 indicators involve automobiles. Eight relate to non-automobile modes such as transit (one deals with freight). The Board of Trade comparisons are skewed because they give disproportionate weight to modes that are relatively minor in metropolitan mobility.

However, the greatest difficulty with the Scorecard is the implied belief greater reliance on transit is preferable. In fact, transit is slower than cars for the majority of trips. Travel time needs to decrease to encourage metropolitan economic growth, as research at the University of Paris indicates. There is probably no more important transportation indicator regarding the economy.

A Globe and Mail article rightly expresses particular concern that Toronto’s round-trip average work trip time ranks last at 80 minutes per day. However, at least two of the metropolitan areas had longer work trip travel times. The average work trip travel time in the Tokyo metropolitan area was 96 minutes in 2003 (the latest data available), according to the Japan Statistics Bureau. The Board of Trade failed to find a number for Hong Kong, which the government reported at 92 minutes in 2002. Yet, these travel time laggards rank first and second in the Board of Trade rankings.

It should be a source of embarrassment that Dallas-Fort Worth, a bane of urban planners and with less than half the Toronto density, should have a work trip travel time one-third less and one-fifth less, respectively, than Calgary and Vancouver, the highest ranked Canadian metropolitan areas.

It’s worse than that. Among all of the large American metropolitan areas, in or out of The Scorecard on Prosperity, all but New York have better work trip travel times.

Except in the romantic minds of planners, little of the present car travel demand can be replaced by transit. Further, in virtually all of the metropolitan areas ranking above Toronto, the trajectory has been toward cars, so that the present figures are less favourable to transit than they would have been a decade or two ago.

For transport to make the greatest possible contribution to economic growth and job creation, the transport system must provide quick mobility throughout the entire labour market (metropolitan area). Transit-favouring ideology will not do.

The problem is evident. The $8 billion just committed by Mayor Rob Ford and Premier Dalton McGuinty to build an Eglinton subway should be used to reduce travel times as much as possible.

A huge expenditure on a single street will not do that.

So long as ideology trumps reality, Toronto’s calcified traffic will put it at a competitive disadvantage. The focus should be on results — the time it takes to get to work, rather than on means — whether the trip is by car or transit.

Wendell Cox writes here as a Senior Fellow at the Frontier Centre for Public Policy in Winnipeg and is a regular contributor to NewGeography.com. This piece also appeared in the Toronto Sun.

Turn the Focus Towards Australia's Regional Towns

Too much property reporting and media attention is given to our capital cities, and not enough effort is spent analysing our regional towns. 

As a result, too few investors understand Australia’s regional potential.  Right now, not only are many of our regional centres at the bottom of their cycle, but larger, long-term trends are at play.  Indeed, regional Australia is on the cusp of some big demographic changes. 

Here’s why:  In recent years our capital cities have attracted around two-thirds of Australia’s population growth, with many of these new residents settling in the outer suburbs. Our capitals also generated the lion’s share of employment. 

But over the last twelve months or so, this trend has shifted, with close to two-fifths of our new jobs now being created away from our major cities and in regional towns.  Past trends suggest that population growth will follow. 

Deteriorating lifestyle (and rising costs) – in our three major capitals, at least – is likely to add further momentum to this new regional push.

It’s not too hard to understand why Australia’s regional areas are sometimes overlooked.  A quick look at the demographics of Australia reveals a country the same size as mainland USA, or 20 times the size of Japan, with only eight capital cities throughout its eight states and territories.  This is one of the most urbanized countries in the world, where only 15% of the population resides in rural areas and a vast interior.   

This week, regional focus has come under the microscope with the unveiling of the 2011 Federal Budget by Australia’s Deputy Prime Minister and Treasurer, Wayne Swan.   The Government plans to flood regional areas with 16,000 skilled migrants via the introduction of new initiatives to encourage skilled migration to regional areas.

Additionally, regional areas are set to receive critical infrastructure upgrades to hospital and health services, and funding to support strategic planning and growth. 

Astute property buyers should start to look beyond the capitals for investment opportunities.  The big winners in this regional resurgence will most likely be the resource towns – the “muscle towns”, as Bernard Salt recently called them. 

By this, we don’t mean the fly-in-fly out places like Moranbah, but places critical to the delivery of iron ore, gas and coal – like Wollongong, Newcastle, Gladstone, Surat Basin (Toowoomba) and Townsville.  Expect big things in these regions.  Two thirds of the new jobs created across Queensland last year were in the Gladstone region alone.

Regional Australia is to become a whole lot more.

The Transportation Politics of Envy: The United States & Europe

The Department for Transport of the United Kingdom may be surprised to learn that the average round-trip commute in the nation is up to a quarter hour less than reflected in its reports. This revelation comes from an article in The Economist, ("Life in the Slow Lane") citing a survey indicating that the average commuter in the United Kingdom spends less than 40 minutes daily traveling to and from work in 2000. According to Regional Transport Statistics, published by the Department for Transport, the average commuter spent 50 minutes traveling to and from work in 2000. The UK government further indicates that the average commute time had risen to 56 minutes by 2009. The Economist relies on the much lower figure (and other similarly low estimates from other European nations) in fashioning an article criticizing transportation policy in the United States.

Shorter US Commute Times: The Economist begins with the contention that the average work trip travel time in the United States is substantially greater than that of the number of European nations. The most reliable data says otherwise.

The most comprehensive work trip data in Europe is maintained by Eurostat, the statistical agency of the European Commission. The Eurostat data indicates that average commute times in Europe are somewhat more than in the United States in metropolitan areas of similar size (Figure 1), when compared to the comprehensive data from the US Census Bureau. For example, among metropolitan areas of more than 5 million population, the daily round-trip average commute is under 58 minutes in the United States, less than the 64 minutes in Europe. European commute times are longer in all population categories (Note).

Overall, the average round-trip travel time in the US metropolitan areas over 500,000 population is 23.6 minutes and 25.3 minutes in the European metropolitan areas.

Moreover, there are indications that the US trend is favorable, at least in comparison to the United Kingdom. Between 2000 and 2009, UK government data shows average round trip commute times to have increased six minutes, while US government data indicates a decline of nearly one minute (Figure 2).

The US: Less Traffic Congestion:  The Economist then asserts that traffic congestion is worse in US metropolitan areas than in Europe. According to The Economist:

...with few exceptions (London among them) American traffic congestion is worse than western Europe’s. Average delays in America’s largest cities exceed those in cities like Berlin and Copenhagen.

The reality is the opposite, according to the INRIX Traffic Scorecard and a more correct rendering of the point above would have been:

... with few exceptions (Los Angeles among them) western Europe's traffic congestion is worse than America's. Average delays in some of western Europe's smallest cities exceed those in cities like Atlanta, Houston and Dallas-Fort Worth.

INRIX compared 2010 peak period traffic delays in metropolitan areas of the United States and Europe. As with commuting time, the average travel delay per driver was greater in Europe than in the United States in every population classification. While Los Angeles has the worst congestion the approximately 200 metropolitan areas (one-half in the US and one-half in Europe), the next 13 worst were in Europe (Honolulu ranks 15th) and 18 of the worst 20 were in Europe (Figure 3). The third worst ranking US metropolitan area was San Francisco, at 28th, while Washington was 29th. Only seven of the 50 most congested metropolitan areas were in the United States. Of course, anyone who has driven extensively in the metropolitan areas of the US and western Europe knows that congestion is generally far worse in Europe, a fact confirmed by the INRIX data.

Indeed, traffic congestion in the smallest European metropolitan areas (under 500,000) was worse than in the largest US metropolitan areas, those with over 5 million (There were no US metropolitan areas with less than 500,000 population in the INRIX data, see Figure 4). Those automobile-oriented, highly suburbanized banes of urban planning, Atlanta, Dallas-Fort Worth and Houston all ranked in the middle, between 90th and 110th. At least 75 European metropolitan areas had worse traffic congestion than all three.

High-Speed Rail Envy: Finally, The Economist decries the lack of high-speed rail in the United States, noting that:

The absence of true high-speed rail is a continuing embarrassment to the nation’s rail enthusiasts.

It is hard to imagine a more pathetic standard for evaluating public policy than "satisfying rail enthusiasts."  It is well known that that governments from Washington to London, Athens and Lisbon are in serious financial difficulty. It is a time for limiting public expenditures to matters of genuine priority. That does not include high speed rail.

The intercity road and airport systems are principally financed by users, in contrast to the operating subsidies and intense (100 percent) capital subsidies required by high-speed rail. This is evident in California with its now $65 billion first line that has more than doubled in real cost in a decade. It is also evident, closer to home for The Economist, where the controversial HS-2 high-speed rail proposal from London to Manchester and Leeds could easily double in cost (to £65 billion), based upon the best international research. Astoundingly, a doubling of cost would be a bargain for Britain's taxpayers compared to two previous high-speed rail failures in the same corridor (See: The High Speed Rail Battle of Britain). The recurring environmental justifications ring hallow due to the high costs and the three generations or more it would require in California and the United Kingdom to eliminate the first gram of greenhouse gas.

Transport policy could be improved in the United States, as well as in Europe. However, the starting point must be facts, not fancy, and certainly not envy.

-------

Note: this analysis includes all data available for metropolitan areas in the United States (metropolitan statistical areas) and Europe (larger urban zones, the closest equivalent to US metropolitan areas). US data is complete, covering all 100 metropolitan areas with more than 500,000 population and is from the United States Census Bureau. European data is principally from Eurostat (94 larger urban zones and three from other sources). Paris data is from IAURIF (Institut d'aménagement et d'urbanisme de la région Île-de-France). Newcastle-upon-Tyne and Leeds data is from the UK Department for Transport.  Data is not available for a number of metropolitan areas with more than 500,000 population in Europe.