NewGeography.com blogs
The battle to find ways to close California's gaping $24 billion budget shortfall continues, with Governor Schwarzenegger calling for deep cuts and reorganization throughout state government. Last week, making a "rare speech to a joint session of the Legislature," Gov. Schwarzenegger argued that the state has "run out of time," and faces a situation where "Our wallet is empty, our bank is closed, and our credit is dried up".
The challenges facing California's policy makers in balancing the budget can be examined by checking out the Los Angeles Times' "Interactive California Budget Balancer". While the state has many different options available to it, making cuts to potentially popular programs will only serve to irritate interest groups which argue for the efficacy and essential nature of their favored programs. Couple this reluctance to make cuts with popular resistance to tax increases, recently seen when voters rejected a set of measures on May 19, and one can better understand the true magnitude of the budget impasse facing the state.
“A new business model” is what Jack Nerad of Kelly Blue Book called the proposed sale of Saturn by General Motors (GM) to Roger Penske’s Penske Automotive Group.
What makes it a new model is that Penske would only buy the brand and the dealer network. Penske would subcontract vehicle production other manufacturers, though for the first two years, the GM Saturn plant would produce the cars. Doubtless, Penske will buy vehicles from assembly plants able to provide the best quality for the dollar, establishing competition at the factory rather than corporate level. This radical departure solves the fundamental problem leading to the near-death of the American automobile industry.
Following World War II, America had little competition. Industrial powers such as in Europe and Japan were flat on their backs and American manufacturers had a “clear field.” American labor and management bid up the price of heavy manufactured goods so much that they became less competitive when war torn economies recovered.
Americans paid over and over again in their automotive purchases. They paid first through reliability difficulties that were the inevitable result of attempting to compete on price with foreign firms with costs that were competitive in world markets. Finally, they paid with more than $60 billion in loans to General Motors, GMAC and Chrysler. Canadians also paid twice, most recently in more than $13 billion in loans that make their per capita contribution substantially higher than that of Americans. It is not at all clear that North American taxpayers will ever see these amounts repaid (American taxpayers are still waiting for the first penny of repayment from Amtrak on loans made more than 25 years ago).
The recent loans were the result of a political consensus that GM and Chrysler were “too big to fail.” In an industry characterized by the Penske-Saturn model, the too-big-to-fail problem would be removed.
There was terrible news for Dayton this week as the city's last Fortune 500 company, NCR, founded locally in 1884, announced it was moving its headquarters to Atlanta. The Dayton Daily News is the place for complete coverage.
This is bad news not just for Dayton, but for the state of Ohio and the entire Midwest. Firstly, it illustrates the plight of the smaller cities of the Midwest, the ones below one million in metro area population that I usually don't write much about. These cities, including places like Dayton, Youngstown, and Toledo, are often struggling. Unless they are a state capital and/or home to a major state university, they just don't seem to have quite the scale necessary to operate in the globalized economy. These cities have special challenges and I won't profess to have answers for them.
Secondly, this is further damage to the economic reputation of the Midwest as a whole. Loyal readers know that I've been skeptical of cross-regional collaboration as a panacea (though I've also written some positive things about it). However, there are clearly issues that affect the Midwest as a whole. It has, for example, a collective reputation as the Rust Belt that probably only Chicago is able to overcome.
This reputation creates formidable brand headwinds in trying to attract the talent needed to compete in the 21st century. The Atlanta Business Chronicle had an interesting take on the NCR move, with one anonymous source attributing it to talent issues with Dayton. "They [NCR] can’t recruit talent to move to Dayton, Ohio."
So what, you might say. It's Dayton. But my town is way cooler than Dayton. Well, the problem extends well beyond Dayton. Consider Ann Arbor. If any city in the Midwest can claim to be a winner in a the knowledge economy, it has to be the home of U of M, the best public university in the Midwest. But according to an article in the Journal, "Despite Ann Arbor's educated work force, employers here find Michigan's reputation as a failing manufacturing economy can deter potential hires from moving to the state."
In short, this thing affects everybody. Even the best regional performers will be fighting horrible brand headwinds as long as the region in which they are embedded continues to fail. It's like a larger version of what I've long said about the Hoosier State, that there can't be a long term prosperous Indianapolis without a prosperous Indiana.
The lessons of Dayton and NCR are not being lost on people locally and around the state at least. Local blog Dayton Most Metro asks, "Are we ready to wake up yet?"
And a columnist in the Cleveland Plain Dealer chimes in with a call to arms for his city.
When Ohio cities lose storied corporate birthrights to the likes of Beijing, Calcutta, or even the green fields of Ohio suburbia, I understand potentially insurmountable market forces at work.
But when we continue to lose to the likes of Georgia, I only recognize underperforming leadership and a criminal failure to anticipate market realities.
In trying to understand the meaning of it all, we should reflect on the somber and lonely sentiments of a Dayton Daily News editorial that noted Wednesday that the city is now on its own.
Closer to home, Cuyahoga County continues to inch closer to its civic funeral. Not only do we continue to bleed off population and shutter what is left of our industrial base, we continue to act in a predictable political fashion that hastens our day of reckoning.
The inability of Cuyahoga County officials to agree on government reform tells the world that Northeast Ohio continues to be no place to do business. Like Dayton, our region remains a corporate cherry-picker's fantasy.
Soon there will be nothing left to govern in Cuyahoga County.
This post originally appeared at The Urbanophile.
Would you like to avoid recessions altogether?
You can come close if you live in the right place.
This report looks at the period January 1991 through April 2009 – a period of 220 months that includes three recessions. Since employment rises and falls monthly because of seasonal trends (school year, holiday retail and more), this report uses 12-month employment growth rates as the measurement criteria – the employment in a given month compared to the employment 12 months earlier. This eliminates seasonality and allows us to compare, if you will, apples with apples.
The metric in this analysis is the percent of months where the 12-month employment growth rate is positive.
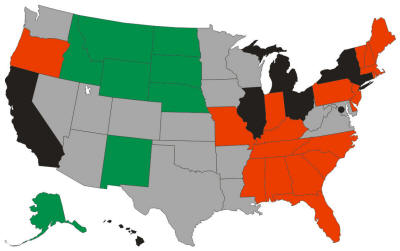 Using employment growth rates as the measurement criteria: Using employment growth rates as the measurement criteria:
Alaska is 99.1% recession-proof since employment was growing for 218 months out of 220.
Michigan is 51.8% recession-proof since employment was growing for 114 months out of 220.
All the states are shown in the graphic, color-coded as follows:
- Green is 90% or more
- Grey is 80% to 90%
- Red is 70% to 80%
- Black is less than 70%
Some metropolitan areas are also relatively recession-proof:
| Area |
Share of months where 12-month job growth rate is positive
|
| Grand Junction, CO |
100.00%
|
| McAllen-Edinburg-Mission, TX |
99.50%
|
| Olympia, WA |
99.10%
|
| Bismarck, ND |
98.60%
|
| Anchorage, AK |
97.70%
|
| Fargo, ND-MN |
97.70%
|
| Tyler, TX |
97.30%
|
| Greeley, CO |
96.80%
|
| Iowa City, IA |
96.40%
|
| Sioux Falls, SD |
96.40%
|
| Cheyenne, WY |
95.90%
|
| Columbia, MO |
95.90%
|
| Coeur d'Alene, ID |
95.50%
|
| College Station-Bryan, TX |
95.50%
|
| Billings, MT |
95.00%
|
| Fayetteville-Springdale-Rogers, AR-MO |
94.50%
|
| Laredo, TX |
94.50%
|
| Las Cruces, NM |
94.50%
|
| Valdosta, GA |
94.50%
|
| Killeen-Temple-Fort Hood, TX |
94.10%
|
| Rapid City, SD |
94.10%
|
| Bellingham, WA |
93.60%
|
| Ogden-Clearfield, UT |
93.60%
|
| Knoxville, TN |
93.20%
|
| St. George, UT |
93.20%
|
And, unfortunately, some metropolitan areas are not very recession proof:
| Area |
Share of months where 12-month job growth rate is positive
|
| Baltimore City, MD |
17.70%
|
| Flint, MI |
28.60%
|
| Detroit-Livonia-Dearborn, MI Metro |
34.10%
|
| Philadelphia City, PA |
35.50%
|
| Dayton, OH |
37.30%
|
| Mansfield, OH |
38.20%
|
| Youngstown-Warren-Boardman, OH-PA |
41.80%
|
| Muncie, IN |
42.70%
|
| Kingston, NY |
43.60%
|
| Waterbury, CT NECTA |
45.50%
|
| Binghamton, NY |
47.30%
|
| Lima, OH |
47.30%
|
| Springfield, OH |
48.20%
|
| Detroit-Warren-Livonia, MI |
49.10%
|
| Lansing-East Lansing, MI |
50.00%
|
| Saginaw-Saginaw Township North, MI |
50.50%
|
| Ann Arbor, MI |
51.40%
|
| Cleveland-Elyria-Mentor, OH |
52.70%
|
| Decatur, IL |
52.70%
|
| Terre Haute, IN |
53.60%
|
| Canton-Massillon, OH |
54.10%
|
| Battle Creek, MI |
54.50%
|
| Jackson, MI |
55.00%
|
| Niles-Benton Harbor, MI |
55.00%
|
You can’t necessarily judge a metropolitan area by its State’s employment growth rates. For example, Georgia is only 73.6% recession-proof yet Valdosta is 94.5%. Indiana is 74.5% yet Indianapolis is 90.0%. Missouri is 72.3% yet Columbia is 95.9%.
A complete list of states and metropolitan areas is available at http://jobbait.com/a/rpa.htm.
The data in this report present only part of a recession-proof picture of states and metropolitan areas. Think of them as a long-term picture from 1990 through April 2009. They do not necessarily represent what’s happening today. For example, Olympia WA which is the second-most recession-proof metropolitan area long term has declines in the last two months, March and April 2009. And, this will change next month and the month after.
This report was written by Mark Hovind, President of JobBait. Mark helps six and seven figure executives find jobs by going directly to the decision-makers most likely to hire them. Mark can be reached through www.JobBait.com or by email at Mark@JobBait.com.
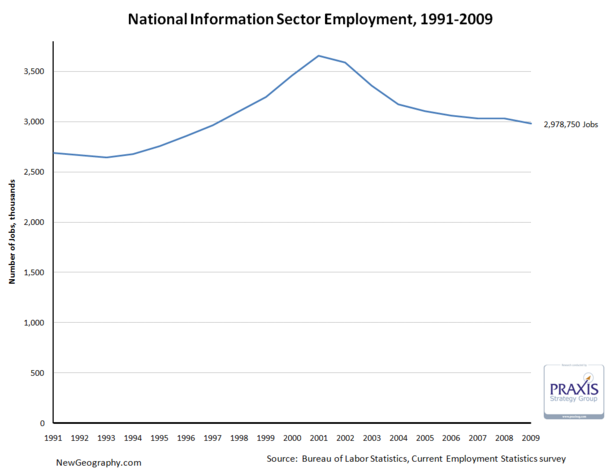
Between economic development strategies targeting software firms, the deflation of the tech bubble, talk of "broadband," and recent consternation about failing publishing business models, we seem to hear a lot about the information sector. Recognizing that, it's interesting that the information sector only comprises about 2.2% of total employment in the US.
On top of that, after a big decline since the tech bubble peak in 2001, in February the sector has receded to just more than 2.9 million jobs, a level not seen since April 1996.
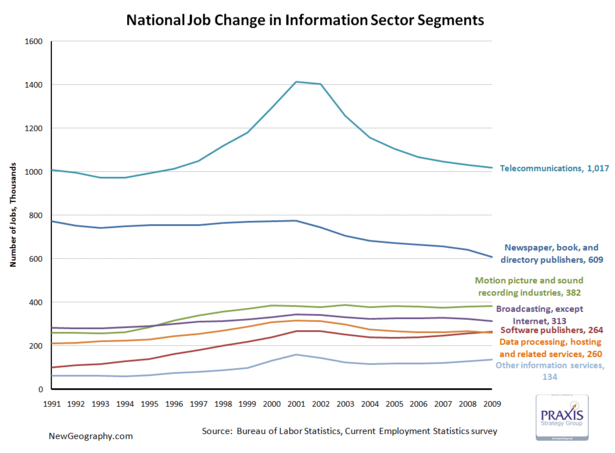
The telecommunications subsector accounts for just more than 1/3 of information employment, and saw the biggest boom and bust. Publishing has declined since 2000, and motion picture and sound recording industries are larger than either software publishing or data processing.
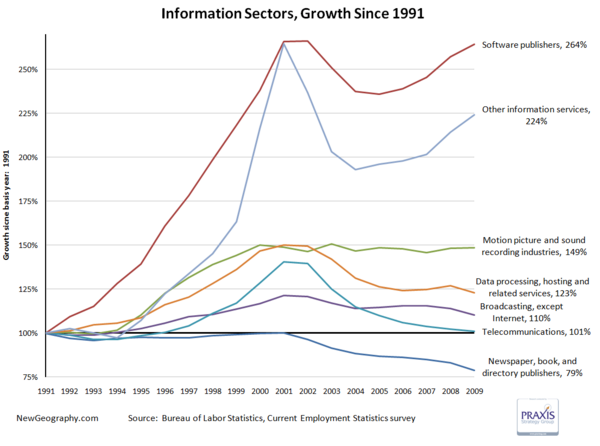
Looking at percent change, software has recovered from the tech bust, while the movie business has remained steady since topping off in 2000. Worse off are telecom and data processing, which continue the post bust slide.
One fifth of the jobs in the publishing industry have vanished since 2001.
This is not to say technology occupations are not a key part of the nation's economy and productivity gains over the past decade, but the importance of the information sector itself is overstated. High-tech industries that produce products generally fall into manufacturing sectors while things like systems design, web design, or even custom programming are business services.
The next post will look at regional shifts in information employment, but until then check out Ross Devol's more comprehensive study on regional tech poles.
Other Information services includes: news syndicates, libraries, archives, exclusive Internet publishing and/or broadcasting, and Web Search Portals.
Shortly after I told you that Bloomberg.com is reporting a running total of the money the U.S. government has pledged and spent for bailouts and economic stimulus, reporters Mark Pittman and Bob Ivry updated the totals: So far, $12.8 trillion has been pledged – an additional $1.2 trillion over the earlier report. The total disbursed through March 31, 2009 stands at $4.2 trillion. The Federal Reserve is still committed to providing the largest share at $7.8 trillion, followed by the U.S. Treasury $2.7 trillion and FDIC $2.0 trillion.
The national debt currently stands at $11.3 trillion — versus an authorized limit of $12.1 trillion. Spending, lending and bailouts by the Federal Reserve are not counted toward the limit.
This week, U.S. Treasury Secretary Timothy Geithner is in China. Mainland China holds $767.9 billion of Treasury securities at the end of March 2009 or about 7 percent of the total national debt. Japan, the second largest major foreign holder, has $686.7 billion.
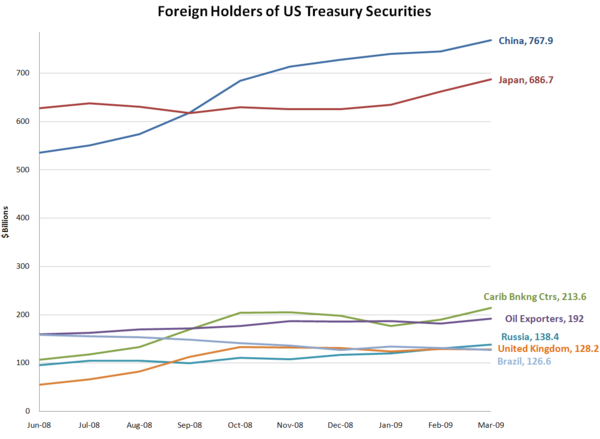
Notes: Data from Department of the Treasury. Caribbean Banking Centers (Carib Bnkng Ctrs) include Bahamas, Bermuda, Cayman Islands, Netherlands Antilles, Panama, and British Virgin Islands. Oil exporters include Ecuador, Venezuela, Indonesia, Bahrain, Iran, Iraq, Kuwait, Oman, Qatar, Saudi Arabia, the United Arab Emirates, Algeria, Gabon, Libya, and Nigeria.
The U.S. bailout commitment of $11.6 trillion equals 89 percent of U.S. 2008 gross domestic product (GDP).
Jonathan Weber writes that "Most demographic and market indicators suggest that growth and development across the country are moving away from the suburban and exurban fringe and toward center-cities and close-in suburbs," in an article for MSNBC entitled Demographic trends now favor downtown: Growth across the country moves away from suburban and exurban fringe.
One might wonder what country Weber is writing about. In the United States, growth and development continues to be concentrated in suburban and exurban areas. Moreover, strong domestic migration continues away from the center cities and close-in suburbs, as evidenced by the fact that between 2000 and 2008, 4.6 million domestic migrants left the core counties of the metropolitan areas over 1,000,000 population, while 2.0 million moved into the suburban counties.
The case is apparently furthered by the obligatory reference and photograph of The Model, Portland, Oregon. However, even in Portland, the suburbs are doing far better than the core. Since 2000, the suburbs have gained 106,000 domestic migrants, while the core county (Multnomah) has lost 4,000 domestic migrants. The IRS micro-data further indicates that the core continues to lose net domestic migration to the suburban counties.
It appears that the only trend indicating that the suburbs are losing out to central cities is the exponential increase in articles blindly parroting “death of the suburbs” dogma.
More than once in this space, I’ve said that derivative financial products set up a perverse incentive where investors have more to gain from the failure of companies and homeowners than their success. If you haven’t seen it yet, take a look at the longer version of my description of the causes and consequences of the current crisis to understand how failed financial innovations, like credit default swaps, contributed to the meltdown of 2008. I wrote that article back in November.
Once again, only Bloomberg.com is out front on this story. More hedge funds are catching onto the casino-like qualities of betting against America’s economic success. Reporters Salas, Harrington and Paulden could have quoted my NewGeography writings directly: “companies [have] more credit-default swaps outstanding than the bonds the contracts protected…” and, referring to Clear Channel Communications, “some of its creditors stand to profit from its failure.”
Told ya’ so!
Political “spin” descended to a new low today with the publication of survey results purporting to suggest that suburban residents and workers are pining for city life. The Washington Business Journal dutifully reported that Today’s suburban workers and residents miss the amenities of cities. The survey sponsor, the Fairfax County (Virginia) Economic Development Authority noted that “almost half of workers who work in the suburbs, say they want more public transportation, more housing options, greater access to useable green space or a better variety of job opportunities – typical features of cities.”
All of this may sound impressive until you realize that no one urban “amenity” was mentioned by more than 25 percent of respondents. That means, for example, that 77 percent of responding suburban residents did not consider “access to convenient public transportation” important enough to mention, while 23 percent did.
According to the Economic Development Authority, the survey indicates that 52 percent of residents “say they would move to a community that offered more of these” urban amenities.
The survey got the moving part right, but missed by a mile on where they are moving. From 2000 to 2008, more than 100,000 domestic migrants left Fairfax County, 11 percent of its 2000 population. But they didn’t move to the city (Washington) or to more urban Alexandria or Arlington, because all of these lost domestic migrants as well. Indeed, the only counties in the Washington, DC area that gained domestic migrants are further from the city than Fairfax County.
It has become customary for the fawning print media to lazily repeat whatever information is provided them by the urbanist lobby. The result is all manner of puff pieces that report as reality what is nothing more than hopes, or even delusions.
The latest puff piece is about Portland and is in today’s Wall Street Journal. The article indicates that 8 percent of Portlanders commute to work by bicycle, based upon data from a bicycle advocacy group. That number is more than five times the figure reported by the United States Bureau of the Census, (which is not a bicycle advocacy group). In 2007 (latest data available), 1.5 percent of Portland metropolitan area workers commuted by bicycle according to the Bureau of the Census.
It is, of course, possible that there is confusion about the definition of Portland. Domestic migration is the principal subject and it is clear from the data cited that the article is citing metropolitan area data, rather than municipal (city of Portland) data.
However, even if we allow that the editors might have erroneously substituted municipal for metropolitan data and that the advocacy group bicycle market share of 8 percent applies to the city of Portland; it would still be off by at least 100 percent. The Bureau of the Census data indicates that 3.9 of workers rode bicycles to work in 2007 in the city of Portland.
Of course, it is always possible that three quarters of metropolitan Portland’s bicycle commuters have fallen off their bikes or that, if the editors were confused as to the difference between metropolitan and municipal, that half have fallen off.
|


