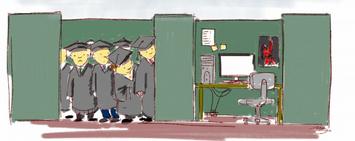
CNBC reports the information technology (IT) sector is “where the jobs are.” And the Los Angeles Times writes that tech jobs in San Francisco are a “rare bright spot in the nation’s troubled economy.”
EMSI’s most current data, however, paints a slightly less rosy picture.
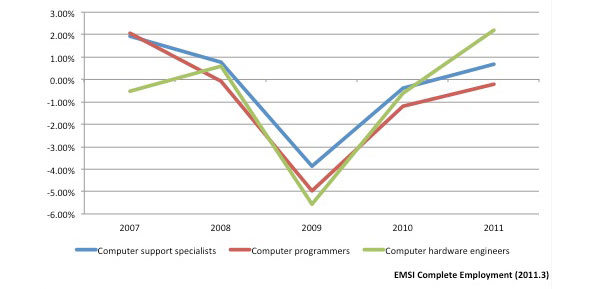
It’s clear that IT and tech jobs have mostly bounced back since the recession (or barely saw employment dips in the first place). But not every tech-related profession is faring well; jobs in computer programming, for example, have failed to reach pre-2008 levels.
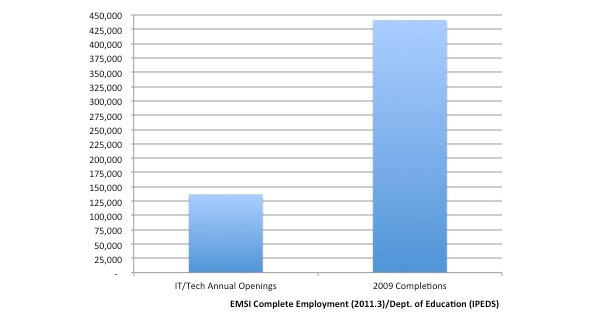
And in almost all cases, the supply of IT and tech grads far outweighs the estimated annual openings in those areas over the next five years.
Overall Trends
IT jobs are spread across nearly every sector, making labor market analysis at the industry level a bit tricky. Tech jobs too are varied and can incorporate many different activities. For this data spotlight, we focused on 11 occupations — mainly in the computer specialist and database/network administrator realm.
| SOC Code | Description |
2006 Jobs
|
2011 Jobs
|
Change
|
% Change
|
|---|---|---|---|---|---|
| 15-1011 | Computer and information scientists, research |
28,349
|
30,648
|
2,299
|
8%
|
| 15-1021 | Computer programmers |
452,953
|
433,188
|
(19,765)
|
(4%)
|
| 15-1031 | Computer software engineers, applications |
511,199
|
555,917
|
44,718
|
9%
|
| 15-1032 | Computer software engineers, systems software |
404,764
|
430,792
|
26,028
|
6%
|
| 15-1041 | Computer support specialists |
572,327
|
567,082
|
(5,245)
|
(1%)
|
| 15-1051 | Computer systems analysts |
584,711
|
606,473
|
21,762
|
4%
|
| 15-1061 | Database administrators |
111,008
|
113,975
|
2,967
|
3%
|
| 15-1071 | Network and computer systems administrators |
347,629
|
358,743
|
11,114
|
3%
|
| 15-1081 | Network systems and data communications analysts |
355,264
|
407,983
|
52,719
|
15%
|
| 15-1099 | Computer specialists, all other |
212,981
|
221,861
|
8,880
|
4%
|
| 17-2061 | Computer hardware engineers |
70,797
|
68,040
|
(2,757)
|
(4%)
|
| SOURCE: EMSI Complete Employment (2011.3) | |||||
In total, these 11 tech-related jobs have grown by 3.9% since 2006 in the US (nearly 143,000 new jobs). The only professions on this list to see a net loss in jobs over the last five years are computer support specialists, computer hardware engineers, and computer programmers.
Computer support specialists account for the second-most jobs of any occupation in this tech group, and they’ve started to make their way back up with growth from 2010-2011. But hardware engineers and programmers continued to shed jobs in the last year — after seeing drops of 5.6% and 5%, respectively, from ’08 to ’09.
Key Industries for Tech Jobs
With EMSI’s research tool, Analyst, we’re able to quickly shift from examining occupations to the top industries that staff those occupations (via inverse staffing patterns). This is a particularly useful analysis for tech jobs.
Consider the case of programmers: the industry breakdown shows this profession is becoming more specialized. In the last five years, there are more programmers in the computer systems design services and custom computer programming services industries, but fewer in generalized industries such as temporary help services, corporate offices, and state and local government.
| FASTEST-CHANGING INDUSTRIES FOR COMPUTER PROGRAMMERS | ||
|---|---|---|
|
NAICS Code
|
Description |
2006-11 Change
|
| 541512 | Computer Systems Design Services |
6,865
|
| 541511 | Custom Computer Programming Services |
5,225
|
| 561320 | Temporary Help Services |
-2,400
|
| 541519 | Other Computer Related Services |
-2,335
|
| 518210 | Data Processing, Hosting, and Related Services |
-1,076
|
| 920000 | State government |
-1,020
|
| 930000 | Local government |
-726
|
| 541513 | Computer Facilities Management Services |
-721
|
| 551114 | Corporate, Subsidiary, and Regional Managing Offices |
-590
|
| 511210 | Software Publishers |
-376
|
This data also suggests that some tech industries — like data processing/hosting services and other computer related services — are either getting by with fewer programmers and other assorted tech workers, or a good number of these positions have been offshored.
That doesn’t seem to be the case as much with software engineers. More of these workers have been added to IT-related industries and general industries since 2006. The biggest exceptions are wired telecommunication carriers and data processing, hosting, and related services.
| FASTEST-CHANGING INDUSTRIES FOR SOFTWARE ENGINEERS (15-1031 and 15-1032) | ||
|---|---|---|
|
NAICS Code
|
Description |
2006-2011 Change
|
| 541512 | Computer Systems Design Services |
35,339
|
| 541511 | Custom Computer Programming Services |
24,660
|
| 511210 | Software Publishers |
5,727
|
| 551114 | Corporate, Subsidiary, and Regional Managing Offices |
3,260
|
| 541712 | Research and Development in the Physical, Engineering, and Life Sciences (except Biotechnology) |
2,971
|
| 517110 | Wired Telecommunications Carriers |
-2,310
|
| 541330 | Engineering Services |
1,310
|
| 518210 | Data Processing, Hosting, and Related Services |
-1,080
|
| 334111 | Electronic Computer Manufacturing |
-1,048
|
Metros with Highest Concentration of Tech Workers
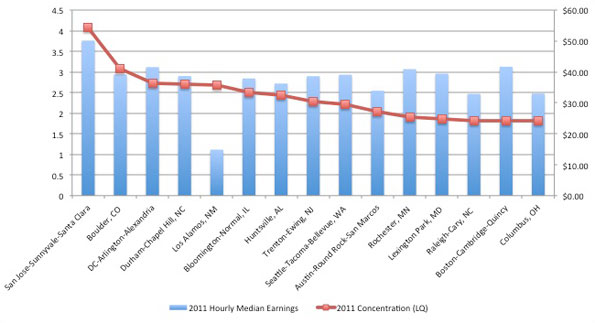
The area with the largest share of tech workers, on a per capita basis, probably won’t come as a huge shock. The San Jose metro, home to Silicon Valley, is more than 4 times more concentrated in tech workers than the nation, and it has the highest median earnings. With a median wage of $50.14 per hour, San Jose has 7% higher wages than the second best-paying metro, Bridgeport, Conn., ($46.59), and 17% higher wages than the third metro on the list, Boston-Cambridge ($41.69).
Boulder, Colo., is the second-most concentrated metro, at more than 3 times the national average, followed by DC (with a location quotient of 2.73) and Durham-Chapel Hill, NC (2.7).
Meanwhile, DC and Seattle-Tacoma have seen the most new tech jobs since 2006. DC has added 18,205 jobs (9%), Seattle has added 14,762 (16%), while San Jose is third with 11,102 new jobs (12%).
Supply/Demand Imbalance
The job market for tech workers in San Jose, San Francisco, and other pockets of the country seems to be thriving. But there also appears to be a considerable excess of new graduates in these fields compared to the annual demand over the next five years. According to EMSI estimates, there are more than 3 times as many graduates as annual job openings through 2016.
We gauged the supply of 2009 grads from programs associated with the 11 tech professions using the US Department of Education’s IPEDS database, and looked at the completions in comparison to estimated annual openings (new and replacement jobs) for the same jobs. Note: Not all graduates from tech-related programs will work in tech-related fields (though in higher-skilled areas such as these, the chances are higher) and IPEDS data is subject to misreporting/error on a college-by-college basis.
Looking at the supply/demand numbers for the individual tech occupations, computer and information scientists have the largest glut (56,865 too many grads per year). Two other occupations have graduate oversupplies that exceed 50,000: network and computer systems administrators and computer specialists, all other.
There’s only one occupation, meanwhile, with a shortage of associated graduates: computer support specialists (not to be confused with computer support specialists, all other).
|
SOC Code
|
Description |
Annual Openings
|
2009 Completions
|
Surplus/Shortage
|
2011 Median Hourly Earnings
|
|---|---|---|---|---|---|
| 15-1011 | Computer and information scientists, research |
1,239
|
58,104
|
56,865
|
$44.90
|
| 15-1071 | Network and computer systems administrators |
13,234
|
66,273
|
53,039
|
$31.75
|
| 15-1099 | Computer specialists, all other |
7,342
|
59,726
|
52,384
|
$35.04
|
| 15-1061 | Database administrators |
3,866
|
46,498
|
42,632
|
$33.48
|
| 15-1081 | Network systems and data communications analysts |
21,081
|
56,792
|
35,711
|
$28.07
|
| 15-1032 | Computer software engineers, systems software |
13,664
|
42,621
|
28,957
|
$42.80
|
| 15-1021 | Computer programmers |
9,670
|
29,847
|
20,177
|
$31.38
|
| 15-1031 | Computer software engineers, applications |
18,951
|
34,105
|
15,154
|
$40.15
|
| 15-1051 | Computer systems analysts |
23,023
|
38,104
|
15,081
|
$34.23
|
| 17-2061 | Computer hardware engineers |
2,420
|
5,804
|
3,384
|
$46.17
|
| 15-1041 | Computer support specialists |
22,449
|
3,424
|
-19,025
|
$21.10
|
| Total |
136,939
|
441,298
|
304,359
|
Joshua Wright is an editor at EMSI, an Idaho-based economics firm that provides data and analysis to workforce boards, economic development agencies, higher education institutions, and the private sector. He manages the EMSI blog and is a freelance journalist. Contact him here.
Illustration by Mark Beauchamp


