Last week, as part of my series on planning reasons behind Detroit’s decline, part 2 of the nine-part series was about the city’s poor housing stock. I started to play with some numbers to see if there was any validity to my opinions about the city’s housing, and I found some very intriguing things. Detroit’s housing stock is definitely unique among its Midwestern and Rust Belt peer cities, and perhaps among cities nationwide. Let’s examine.
Grouping the cities by population figures from the 2013 U.S. Census population estimates, and housing data from the 2008-2012 American Community Survey, I looked at housing age and single family detached housing data for 15 Midwest/Rust Belt cities with populations above 250,000. One city I typically include in an analysis like this, Louisville, was not included due to a lack of ACS data. Data for the Twin Cities of Minneapolis and St. Paul were aggregated into one (sorry, Minneapolis and St. Paul) because they jointly function as the core city for their region. Here’s the big table with all the data:
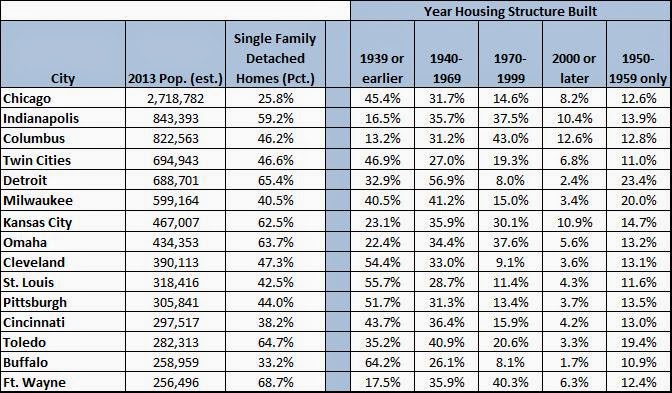
That’s a lot to digest, so I’ll take the data piece by piece. First, let’s look at the cities ranked by their percentage of housing units built in 1969 or earlier:
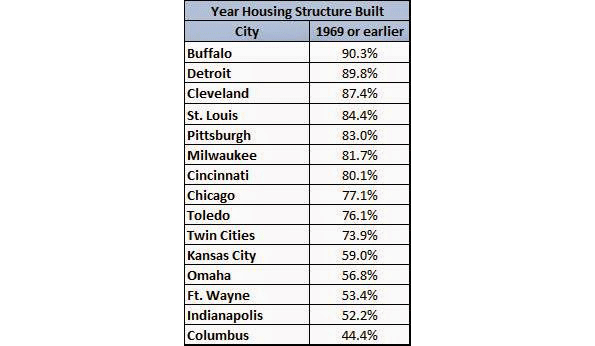
You’ll see here that, perhaps following the general national perception of Detroit housing, the Motor City has an older housing stock. Only Buffalo has a higher percentage of older housing. Generally speaking, the cities at the top half of this list have older housing because they lack redevelopment activity that replaces older housing, while cities at the bottom half consists of cities with decent levels of redevelopment activity, or more recently built housing that’s been annexed into the city in recent decades. Here, Detroit does seem to fit the pattern.
But does it really? If you look at the Census’ earliest category for age of structure, 1939 or earlier, Detroit drops considerably on the list:
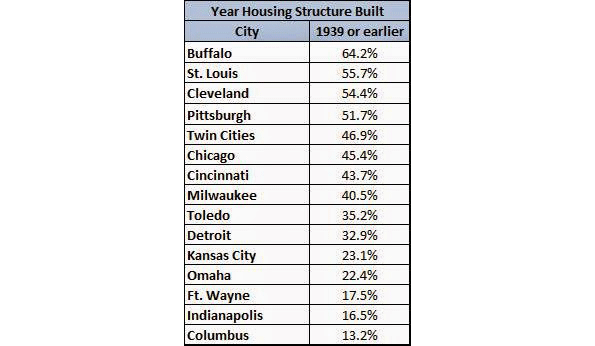
Instead of ranking second as in the earlier table, Detroit falls to tenth. The rest generally hold the same spots they occupied from the previous table as well. The only ones ranking lower than Detroit here are smaller cities (Omaha, Ft. Wayne) and the cities that annexed large amounts of land post 1970 (Kansas City, Indianapolis, Columbus).
Next, let’s look at how the cities rank in terms of their concentrations of single family detached homes:
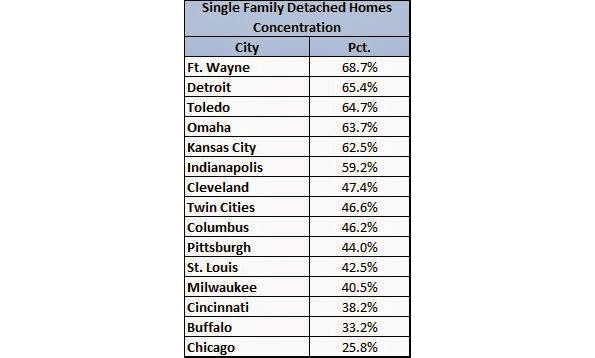
Detroit shows up here with the second highest percentage of single family detached homes, comprising nearly two-thirds of the city’s housing stock. Once again, the only comparable cities are the smaller cities and the big annexers.
Clearly, most observers believe Detroit has more in common with Buffalo, Cleveland and Pittsburgh than with Ft. Wayne, Kansas City and Indianapolis. What happened to Detroit’s housing stock that gave it such an odd profile?
To understand, let’s pull out a specific category on the age of structure table, the 1950-1959 category:
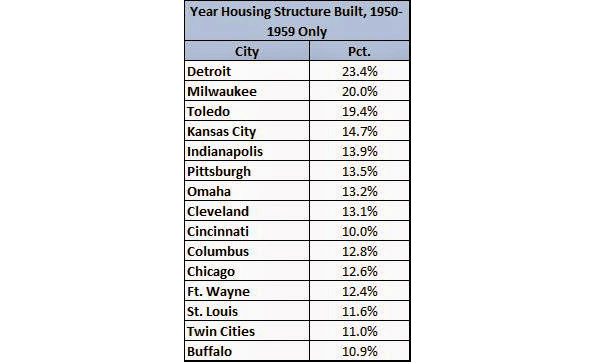
Here, we find that Detroit has, by far, the highest concentration of housing units built between 1950-59 of all its peer cities. Nearly one in four homes in Detroit were built during this period. In fact, Detroit, along with Milwaukee and Toledo, occupies a strange space among Midwestern/Rust Belt cities. (Side note: the more I study Detroit against other Midwestern cities, the more I find that Detroit and Milwaukee are virtually the same city. And it doesn’t surprise me that Toledo, just 75 miles from Detroit, would share its characteristics as well). Detroit, Milwaukee and Toledo all added their greatest numbers of housing at the outset of the modern suburban development period, what I’ve called the Levittown Period in my so-called Big Theory of American Urban Development. This supports my thinking that if anyone was ever interested in establishing a Levittown-style national historic district, Detroit would be a good candidate. The Motor City has perhaps more small Cape Cod-style, three-bedroom, one-bath single family homes than any city in the nation.
How did Detroit get this way? Housing demolition likely had some role in a city that lost so much. Detroit likely lost older single family homes and multifamily buildings over the last few decades, leading to skewed numbers. The same is also true of Indianapolis, Kansas City and Columbus, cities that annexed large undeveloped areas after 1970 and built new housing there. Keep in mind, though, that Milwaukee and Toledo, Detroit’s comparables, may not have had the same level of demolition loss that Detroit had, yet they still match the Motor City well.
That leads me to believe that a concentration of housing development at a unique time is a crucial piece in understanding Detroit’s housing stock.
Here’s another way of looking at this. I grouped the cities by age and single family home concentration and came up with interesting groupings:
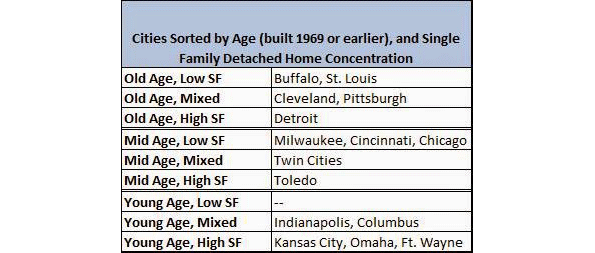
Here it becomes clearer that Detroit and Toledo stand alone as locations for old or moderately old structures that are largely single family. Also, Milwaukee’s greater mix of single family and multifamily units begins to set it apart from Detroit and Toledo, even when it has a similar concentration of Levittown-style housing.
Finally, let’s consider housing adaptability as part of the housing stock analysis. Chicago, the region’s largest city and lone “global city” member of the group, comfortably rests in the middle of all tables except for the single family detached table, where it shows the lowest concentration of single family homes. My guess is that Chicago’s continued desirability means more newer housing has been built, and that its lower single family housing numbers mean that other housing types (lofts, condos and the ubiquitous 2-flat and 3-flat) created a more flexible and adaptable housing development landscape.
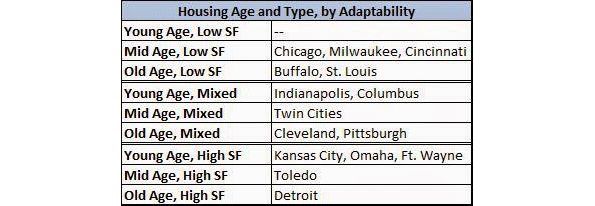
Assuming that younger structures are more often suitable to renovation for adaptability, moderately old structures require more intense rehabs, and older types are more often subject to demolition and rebuilding, I reorganized the previous table in terms of housing adaptability:
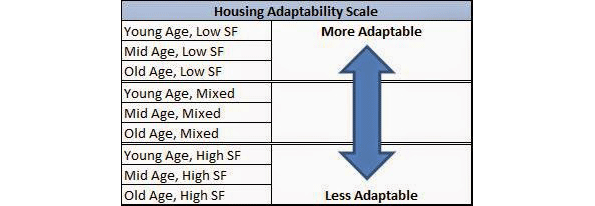
And if I put in the cities next to this adaptability scale, it’s easy to see the magnitude of Detroit’s housing challenges:
Detroit is such a unique city in so many ways. The Motor City needs more research and analysis that highlights its uniqueness and adds to our understanding of the what led to its downfall, and less of our ire and contempt.
The more I study Detroit, the more I see the seeds of a similar downfall in other cities nationwide.
This post originally appeared in Corner Side Yard on July 6, 2014.
Pete Saunders is a Detroit native who has worked as a public and private sector urban planner in the Chicago area for more than twenty years. He is also the author of "The Corner Side Yard," an urban planning blog that focuses on the redevelopment and revitalization of Rust Belt cities.
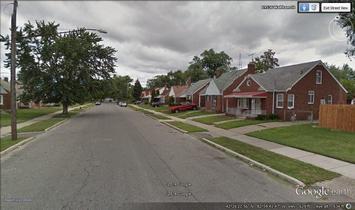
Lead photo: A scene from the Grixdale neighborhood on Detroit’s northeast side. Source: Google Earth.


Actually not suprising if you look at population numbers.
Detroit was a large city and it took until nearly 1950 to fill it to near its boundries. In 1950 the population was 1.849 million and in 1940 1.623 and in 1960 1670. So the population peaked in the 1950s. Consider that if you go into to the outer regions of the city you do get into developments built in the post WWII timeframe. Of course this was the peak years of the Detroit auto industry, which with the need for housing post WWII explains the large amounts of building. (A lot of folks moved north during WWII and housing was tight during the war, so afterwords there was a lot of house building.