NewGeography.com blogs

Misunderstanding the Geography of Sydney, Paris, Mexico City, Etc.

Sydney's Daily Telegraph announced on April 20 that Sydney is more dense than Mexico City, London, Los Angeles and Paris. Of course, anyone who has been to Mexico City or London knows that this is untrue and it may surprise some that Sydney is not even as dense as Los Angeles.

The article never indicates, quite for sure, what it means by Sydney, the Sydney city council area (the urban area's core local government authority, or LGA) or the Sydney urban area. Nor does the article provide an overall density, instead only indicating that there are 8,800 persons per square kilometer in "Sydney's east" and 7,900 per square kilometer in "Sydney City's west."

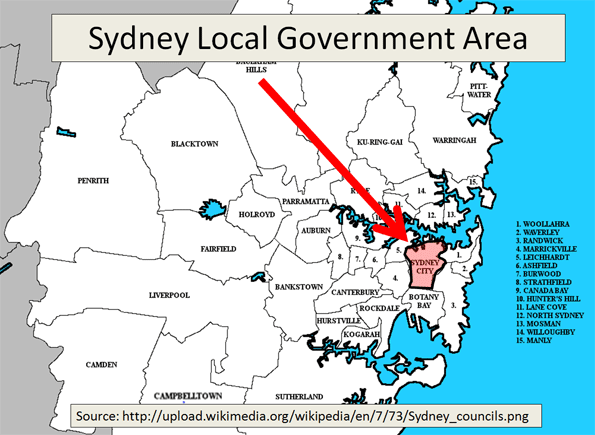
In fact, the figures are from the latest statistical local area estimates of the Australian Bureau of Statistics (ABS) for 2010, and dated March 31, 2011. A "statistical local area" is a part of an LGA (See map: Sydney Local Government Area). The statistical local areas cited by The Daily Telegraph are Sydney-East and Sydney-West, which have a combined density of 8,300 per square kilometer. The small size of the Sydney-East and Sydney-West statistical local areas is illustrated by the fact that each is about the same size as the Sydney Olympic Park.

Comparing Urban Area Densities: The Daily Telegraph's contention results from a profound misunderstanding of urban geography. The result was a comparison of urban geographies that are not comparable.

The Daily Telegraph compares the density of these two small areas of the Sydney LGA, with the urban area densities of Mexico City (which the Daily Telegraph places at 8,400), London (5,100), Los Angeles (2,750) and Paris (3,250). These figures were taken from an earlier edition of Demographia World Urban Area. (Our latest Demographia World Urban Area data, including estimated population densities for all urban areas in the world of more than 500,000 population is here). Urban areas are areas of continuous urban development.

The appropriate Sydney geography for comparison to the urban area populations of Mexico City, London, Los Angeles and Paris is the urban area (the international term), which is called the urban centre by ABS (See map: Sydney Urban Area).

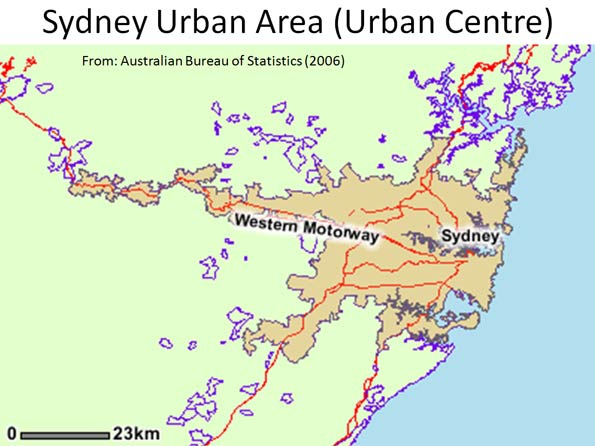
The Sydney urban centre covers an area extending south to Campbelltown, north to Palm Beach and well into the Blue Mountains on the Great Western Highway. According to the ABS, the Sydney urban area (urban centre) had a population of 3.641 million in 2006 (latest available data), and covered a land area of 1,788 square kilometers. This means that the population density of the Sydney urban area was 2,037 in 2006. Thus, the Sydney urban area has a lower density than all four international urban areas used in The Daily Telegraph comparison (Figure 1).

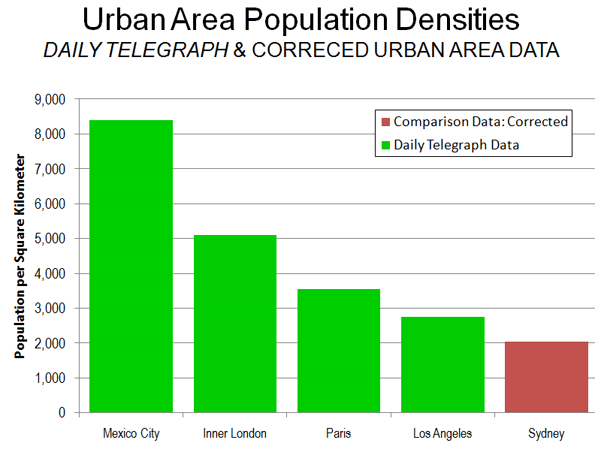
If the Sydney urban center were as dense as the Los Angeles urban area, the population would be 5 million, instead of 3.6 million. If the Sydney urban centre were as dense as the Mexico City urban area, the population would be 15 million.

Comparing Core Densities: The small area densities that The Daily Telegraph cites are also smaller than those that exist in the core areas of the cited international urban areas (Figure 2).


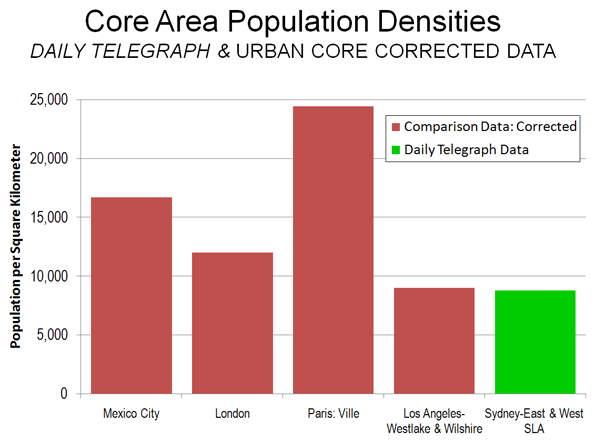
  • In Mexico City, the delegation (district) of Ixtacalco has a population density double that of the Sydney-East and Sydney West statistical local areas (approximately 17,000), in an area nearly twice as large.
  • The 2001 census placed the inner London borough of Kensington and Chelsea at 12,000 persons per square kilometer, in an area approximately the same size as Sydney-East and Sydney-West combined.
  • The ville de Paris has a population density of more than 24,000 per square kilometer, nearly three times that of the combined Sydney-East and Sydney-West statistical local areas. The ville de Paris covers approximately eight times as much land area and smaller area densities are even higher.
  • The 2000 census placed the adjacent Wilshire and Westlake Community Districts of Los Angeles at 9,000 per square kilometer. This is slightly higher than the density of the combined Sydney-East and Sydney-West statistical local areas, in an area nearly four times as large.

The Sydney urban center and statistical local area data is summarized in the table.

The Australian Population Debate: An important public policy debate is under way in Australia on the issue of population growth. As Ross Elliot indicated (Malthusian Delusions Grip Australia), some interests believe that the nation is running out of land. In fact, only 0.3 percent of Australia's land area is urban, a figure one-tenth that of the United States. The starting point for these discussions needs to be valid data and an understanding of the terms involved.


SYDNEY URBAN CENTER & DENSE STATISTICAL LOCAL AREAS
Areas Cited by The Daily Telegraph
  2006 Population Land Area (Square Kilometers) Density 2010 Density
Sydney-East Statistical Local Area         46,738                6.0       7,790          8,799
Sydney-East Statistical Local Area         38,382                5.7       6,734          7,852
Combined         85,120               11.7       7,275          8,338
Share of Sydney Urban Area (Urban Centre) 2.3% 0.7%
Balance of Urban Area (Urban Centre)     3,556,301          1,776.4       2,002 Not Available
Total Sydney Urban Area (Urban Centre)     3,641,421          1,788.1       2,036 Not Available
Notes: 
Data from Australian Bureau of Statistics
Urban centre data available only for census years

Shanghai: Torrid Population Growth

The population of the provincial level municipality of Shanghai exceeded 22 million at the end of 2010, according to the Shanghai Population and Family Planning Commission. The population of 22.21 million exceeds the 2000 population of 16.41 million by 35 percent. This growth of nearly 6 million is more people than live in all but three Western European urban areas (Paris, London and Essen-Dusseldorf).

Virtually all of the population gain was among migrant (non-permanent) residents who lack official Shanghai registration (Shanghai Hukou status). The migrant population rose from 5.9 million to 8.1 million, an increase of 153 percent (Estimates place the number of non-permanent urban residents of China as high as 200 million). There were 14.1 million permanent residents (with Shanghai Hukou status), a seven percent increase from the 2000 figure of 13.8 million (Figure).

Non-permanent residents, who must have lived in Shanghai for six months to be counted, now account for 36.4 percent of the provincial level municipality's population, nearly double the 19.4 share in 2000.

Results are expected soon from the China national census, which began in November of 2010. Ding Jinhong, director of East China Normal University's School of Social Development has suggested that the census may report a population as much as 23 million, with a non-permanent resident population of 9 million.

It is estimated that the Shanghai urban area, which is wholly contained within the provincial level municipality, will have a mid-year 2011 population of 18.7 million, with a land area of 1,125 square miles (2,900 square kilometers). The Shanghai urban area, the 10th largest in the world, has a population density of 16,500 per square mile or 6,400 per square kilometer.

This urban density is more than double that of Western European urban areas with more than 500,000, however it is less than one-fourth that of the Mumbai urban area. As in Mumbai, there has been substantial population dispersion from the core to suburban areas, with only 14 percent of growth in the urban core (generally inside the inner-ring expressway) between 1982 and 2000.

The population density of the provincial municipality, which is analogous to a metropolitan area and includes considerable rural land, is much lower, at 9,100 per square mile (3,500 per square kilometer).

A Tough Week for High Speed Rail

The week ended April 16 was particularly difficult for high speed rail, as the following events illustrate.

1. High Speed Rail Zeroed Out of US Budget: The US federal budget deal, which cut $38 billion from spending ($76 billion annualized) zeroed out the $2.5 billion 2011 budget allocation for high speed rail and $400 million of prior spending authority from President Obama's "stimulus" program, that had provided $8 billion for high speed rail in 2009. Approximately $2 billion of that authority remains and applications total $10 billion, mostly for conventional intercity rail services, rather than genuine high speed rail service.

2.  Missouri Legislators Block High Speed Rail: Members of the Senate Transportation Committee in Missouri refused to place high speed rail in the annual state budget. Governor Jay Nixon is seeking more than $1 billion for intercity out of the remaining $2 billion from the original Obama Administration $8 billion program. Governor Nixon indicates that he will try to get the money placed in the budget should the US Department of Transportation award a grant. Missouri joins Florida, Wisconsin and Ohio in taking actions to block funding for high speed rail projects. This reluctance is principally the result of concerns that high speed rail will incur significant cost overruns and require operating subsidies, all of which would have to be paid for by the states, which generally face serious financial difficulties.

3. China Slows Down Trains: Safety, energy conservation and fare equity issues led the Ministry of Railways to announce a slow-down of its fastest trains to a maximum speed of 300 kilometers per hour (186 miles per hour). This could add materially to travel times, especially in the longer corridors being developed, which traverse the greatest distance of any in the world (such as Shanghai-Kunming, Shanghai-Beijing and Beijing-Hong Kong).

4. Opposition to Britain's HS2 Line Intensifies: Opposition continues to mount against Britain's HS2 line from London to Manchester and Leeds. Protesters showed up at a Department of Transport event at Northampton Station intended to obtain views on the government's plans. Lizzy Williams, chair of "Stop HS2" expressed concern that the government's "consultation" was not objective and told only one side of the story, ignoring the difficulties (A video of Ms. Williams at an anti-HS2 convention is here). Opposition groups also plan a rally on May 8. Finally, it was reported that projected time savings on the line have been exaggerated by the government.

China Slowing World's Fastest High Speed Rail

The Wall Street Journal reports that China will slow down its world's fastest high speed rail trains. According to the Journal, Sheng Guangzu, head of China's Ministry of Railways, told the People's Daily that the decision will make tickets more affordable and improve energy efficiency on the country's high-speed railways. The maximum speed will be 300 kilometers per hour (186 miles per hour), which is also the top speed for most high speed rail trains in Japan, France, Korea and Taiwan. The United Press reported that the 300 kph service would be limited to the four north-south (Beijing to Harbin, Beijing to Shanghai, Beijing to Hong Kong and Shanghai to Shenzhen) and east-west lines (Qingdao to Taiyuan, Lanzhou to Xuzhou, Shanghai to Chengdu and Shanghai to Kunming). Both sources were unclear as to whether the new speed limit would apply to the proposed 380 kph Beijing to Shanghai line, however that line is one of the four north-south trunk routes, all of which will operate at the slower speed according to the Ministry of Railways.

Currently, the world's fastest high speed rail trains operate on the Guangzhou (South Station) to Wuhan route, which reaches 350 kilometers per hour on its fastest service (which stops in Changsha, the non-stop service having been cancelled), completing the run in 3:16. This lower speed could increase travel time on the route to between 3:30 and 3:45.

The Journal cited a high-speed rail official (not Chinese) who indicated that there are safety concerns with trains running at above 320 kph. In contrast, the proposed California high speed rail line would operate at top speeds of 355 kph.

Photo: Nanjing high speed rail train, Shanghai Station (by author)

United States: Less Congestion than Europe per INRIX

A new international report indicates that traffic congestion in the United States is far better than in Europe. The report was released by INRIX, an international provider of traffic information in 208 metropolitan areas in the United States and six European nations.

The report shows that the added annual peak hour congestion delay in the United States is roughly one-third that of Europe. The rate of France was somewhat less than twice the rate of the US and rates in Luxembourg, the United Kingdom, Germany and the Netherlands were three times as high.

In the United States, peak period traffic congestion adds 14.4 hours annually per driver. This compares to an average delay per year of 39.5 hours for the European nations. Luxembourg, the United Kingdom, the Netherlands and Germany had the greatest lost time, at from 42 to 47 hours. Again, France scored the best in Europe, at 24.1 hours of lost time in traffic per year (Figure).

Among individual metropolitan areas. Los Angeles had the greatest peak hour delay, at 74.9 hours annually. Utrecht (Netherlands), Manchester (United Kingdom), Paris, Arhem (Netherlands) and Trier (Germany) second through sixth in the intensity of traffic congestion, all with 65 or more hours of delay per driver per year.

These findings are consistent with international data indicating that traffic congestion tends to be more intense where there are higher urban population densities.

Bus Versus Train: A Dying Debate

The Los Angeles Metropolitan Transportation Authority’s cutbacks on its bus line, eliminating about 12% bus service, illuminate the problems of mass transit in LA, specifically the relative inefficiency of trains in the city. This 12% is a further reduction after the 4% cutbacks six months ago, sparking anger from the Bus Riders Union. Metro Chief Executive Art Leahy says that his decision to decrease spending is a result of the low ridership, yet city trains, which are also underperforming, remain relatively untouched.

Leahy argues that buses are easier to eliminate, re-route, and reschedule than rail lines are. However, he also says that the cutting back on lesser-used bus lines will free up the resources to enhance the ones in higher demand. Many bus riders feel that they are getting a raw deal seeing as bus lines, which transport 80% of the MTA’s passengers, only get 35% of the operating budget to begin with. This being true, how much is the other 65% really helping the rail lines then?

The Bus Riders Union thinks that the MTA’s preference for trains over buses is an unfair reflection of class interests. Because rich people do not take the bus, there is no incentive to keep it running. As is becoming increasingly clear, especially with the current high-speed rail discussions, rich people don’t want to ride the train anymore either. This local debate, therefore, is not an argument of whether to cutback on buses or trains; it is an argument about how to deal with the general decline in mass transit.

The 30th Anniversary of the C-Train in Calgary

I’ve spent a good chunk of the last few months working on a study of Calgary’s light rail transit (C-Train) system, which was released today by the Frontier Centre for Public Policy.  I’ve had a long standing interest in LRT systems, and spent the summer of 2009 working for the Cascade Policy Institute in Oregon, where we compiled massive amounts of data on their world renowned LRT system as part of an ongoing project.  The data (including actual field research, which proponents of the system haven’t done–they rely on survey data), indicates that ridership is lower, and costs are far higher than proponents believe.

That firsthand experience (which included riding the train every day), coupled with the empirical literature from light rail systems across North America, shattered my previous conviction that light rail transit can be an economical method of transit.  For the record, I do believe that subways can be profitable in dense urban cores (even the badly managed TTC nearly breaks even), and buses already are profitable in many cases (especially inter-urban bus services, such as Greyhound and Megabus).  Many proponents of LRT believe that it is a happy medium between subways and buses.  If that were the case, it would be profitable.  However, LRT combines the disadvantages of the two: it is slow, inflexible, and expensive.  Numerous studies, in particular an authoritative study by the non-partisan United States Government Accountability Office, have demonstrated that on average, buses are a cheaper, faster, and more flexible than LRT for providing mass transit.

While I use many different metrics to demonstrate that the costs and benefits of LRT are wildly exaggerated, my favorite is that Calgary spends both the most on transit and the most on roads per-capita.  Given that Calgary’s entire land use and transportation framework for the past several decades has been built around the C-Train, it is hard to call it anything but a failure. The City has cracked down on parking so aggressively to encourage people to ride the train that there are only 0.07 parking spaces per employee in the central business district.  Because of this, Calgary is tied with New York for the highest parking prices on the continent.  But many of those people who would otherwise have parked downtown instead park in the free parking spots provided at C-Train stations.  Not only is free parking horribly inefficient, but this also emphasizes one of the major contradictions of the C-Train: it isn’t getting people out of their cars, and it isn’t helping to curb urban sprawl–two of its primary goals.

Unsurprisingly, those last two findings proved controversial, though not as controversial as my assertion that the C-Train fails to help the urban poor.  A columnist for the Calgary Herald wrote an angry response to my Herald article that accompanied the story (though doesn’t seem to have read the study).  She attempts to refute my arguments about urban sprawl, and the impact of the C-Train on the poor, while dismissing the study as “a cost-benefit analysis guaranteed to resonate with other right wingers who share the mantra of lower taxes above all else, including over the reality of everyday experience.” I’m not clear on when cost-benefit analysis became a right wing concept, but I’ll let that one go.  I will, however, address her two criticisms in short order.

The idea that urban transit could worsen sprawl seems odd.  The reason why it does so in Calgary is because the C-Train network is built on a hub and spoke model.  What this means is that transit is concentrated on going from the outskirts, into the city center.  Since LRT is so expensive, and since people need to be ‘collected’ by buses to get to LRT stations, the city has less resources to provide transit circling the core, or travelling east-west.  And if you can’t provide good transit for people who aren’t living along LRT lines, and don’t work along one of the lines, people are just going to keep moving further out (hence the highest road costs in the nation).  Here’s what Calgary Transit’s current planning manager has to say about the C-Train’s impact on sprawl:

“In one respect, it should allow Calgary to be a more compact city, but what it’s done is it’s actually allowed Calgary to continue to develop outward because it was so easy to get to the LRT and then get other places,” says Neil McKendrick, Calgary Transit’s current planning manager.”

While that comment is true for those who can afford to live by LRT stations (or to drive to them), it doesn’t apply to the city’s poorest.  As it happens, LRT lines raise the cost of adjacent housing (though for proximate high end housing it lowers the value–hardly a concern for the poor)–by $1045 for every 100 feet closer to a rail station.  This isn’t a terribly complicated concept.  If you spend a massive amount of money on a form of transit that is considered to luxurious, the price of housing goes up. This is exacerbated by the fact that diverting transit resources to those areas makes transit there comparatively better, making it that much more desirable comparatively for people who intend to use transit at all–even as just an occasional amenity, say for going downtown on weekends.  LRT is great for people who can afford to live by the stations, but not so much for anyone else.

Unfortunately, for many, light rail transit has become a sacred cow.  But if Calgary is ever going to have adequate rapid transit, the City will need to explore more cost effective options.  Buses may not be trendy, but expanding BRT in Calgary would dramatically improve people’s mobility at a reasonable cost. Fortunately, the current Mayor has acknowledged that BRT will have to be part of the solution for making Calgary a transit friendly city.  He also made the wise decision of de-prioritizing the southeast LRT extension (expected to cost $1.2-$1.8 billion). If the Mayor follows up on his promise to make BRT an integral part of Calgary Transit in the short term, the City will not only have far better transit, but it will have a chance to watch the LRT and BRT operating side by side so that the people can decide for themselves whether the billion plus required to build the Southeast LRT is worthwhile.  My bet is on BRT.

This piece originally appeared at stevelafleur.com

Zhengzhou Ghost City Alive!

Zhengzhou, Henan, China (March 28, 2011): In December, London’s Daily Mail reported that the Zhengzhou New Area was China’s largest “Ghost City.” A visit to the Zhengzhou New Area indicates exactly the opposite. Chinese “Ghost Cities” are large areas of new development that are virtually unoccupied. The most famous example is Ordos, a new and reportedly empty city, built to replace an older city in Inner Mongolia.

Zhenghou is an urban area of approximately 2.5 million population and is the capital of Henan province. The Zhengzhou New Area is located in the northeastern quadrant of Zhengzhou. It is circular in design, with two parallel roads, high-rise condominium buildings on the inner ring and commercial buildings on the outer ring. The interior of the circle includes the Henan Arts Center and a skyscraper that is under construction. A new high speed rail station is under construction to serve the new Guangzhou to Beijing line. The station is to be one of the largest in Asia.

Our visit revealed anything but a Ghost City. Granted, no-one would mistake the traffic for Beijing Third Ring Road volumes, but virtually all of the parking spaces were taken and there was traffic on the streets (Figure 1). That ultimate indicator of Chinese urbanization, the availability of frequent taxicab service was well in evidence. Two of the city’s bus rapid transit lines serve the interior circle road, again indicating a substantial threshold of non-ghost urbanization.

There were people on the sidewalks, though not the numbers typical of an older, more dense section of a Chinese urban area (Figure 2). It was clear from the laundry hanging in glass enclosed patios that many of the condominiums were occupied, though it is to be expected that many would not be, given the Chinese propensity to invest in multiple residential properties (a tendency the central government seeks to curb). Many of the commercial skyscrapers were occupied, and some were still under construction. There are also shopping centers, small stores and fast food restaurants.

Zhengzhou New Area is intended by the developers to become the new central business district for Zhengzhou. There is much more planned than this first phase. Eventually, the Zhengzhou New Area is intended to cover 105 square kilometers (41 square miles), generally further to the northeast. City maps already show the planned street pattern, not unlike 19th century maps of some US cities.

In short, the Zhengzhou New Area is alive and not a Ghost City. It may well be that it took longer than expected for the place to come alive. But it is clear that the life of the Zhengzhou New Area began more than four months ago.

Vancouver Olympic Villiage Scandal Gets Worse

The Vancouver Olympic Village scandal continues to worsen.  During construction, the City of Vancouver was forced to take over financing of the project, as the developer’s initial lender backed out due to cost overruns.  At the end of last August, the developer fell behind its payment schedule, and the City placed the property into receivership in November.  The development has been a spectacular failure, with fewer than half of the 737 units being sold.  The outstanding debt to the city is $743 million.  To make things worse, a quarter of the tenants are now suing the City. 

One might expect that a billion dollar development for Olympic athletes would be pretty posh.  Prices ranged from $530,900 for a 566 square foot studio, to $4.8 million for three bedroom units.  Even in unaffordable Vancouver, you’d expect that to come with a bedroom big enough to fit a bed.   According to tenants, they didn’t even get that.  What they did get was bizarre leaks, cracking ceilings, and inadequate heating.  The project sounds like something out of Arrested Development, or as the tenants’ legal counsel put it, “It’s like they were sold a BMW and they got a broken Toyota. And even if they manage to fix everything, it’s still a Toyota.”  The units are far from the luxury accommodations buyers were lead to believe they were getting.

In short, the lawsuits seem perfectly legitimate, and are likely to cost the City another $50 million dollars.  It’s also hard to imagine this quagmire will help the value of the units on the market.  Even before the horrendous conditions of the condo units were made public, reports claimed that the development was worth $150-200 million less than what was owed to the city.  It is hard to imagine a scenario where the city isn’t stuck with hundreds of millions of dollars of losses. 

Of course, none of this should come as a surprise.  Government housing projects generally fail.  And if governments can’t build adequate housing for the poor, it’s hard to imagine them building upscale housing at a price that the market will bear.  Hence the shoddy work.  The lesson here is a simple one, that history proves again and again: governments make bad landlords.

Final Census Results: Core Cities Do Worse in 2000s than 1990s

Based upon complete census counts for 2010, historical core municipalities of the nation’s major metropolitan areas (over 1,000,000 population) captured a smaller share of growth in the 2000s than in the 1990s.

The results for the 50 metropolitan areas (New Orleans excluded due to Hurricane Katrina and Tucson unexpectedly failed to reach 1,000,000 population) indicate that historical core municipalities accounted for 9 percent of metropolitan area growth between 2000 and 2010, compared to 15 percent in the 1990-2000 period. Overall, suburban areas captured 91 percent of metropolitan area population growth between 2000 and 2010, compared to 85 percent between 1990 and 2000.

Total population growth in the historical core municipalities was 1.4 million, nearly all of it in municipalities with a largely suburban form (such as Phoenix, San Antonio and Charlotte). This compares to an increase of 2.9 million during the 1990s.

Suburban areas (areas in metropolitan areas outside the historical core municipalities) grew 15.0 million, down from 16.1million.

Overall, the major metropolitan areas added 14 percent to their populations in the 2000s, down from 19 percent growth in the 1990s. The historical core municipalities grew 4 percent, compared to the 1990s rate of 7 percent. Suburban areas grew 18 percent, compared to the 1990s rate of 26 percent (all data unweighted).