NewGeography.com blogs
New US Census Bureau state level estimates have just been released. Repeating the pattern similar to that developing since 2010, North Dakota, the District of Columbia, Texas, Utah and Colorado have posted the strongest percentage gains. North Dakota added 3.1 percent to its population between 2012 and 2013 and 7.6 percent since the 2010 Census. Close behind was the District of Columbia, which added 7.4 percent since 2010, though its growth over the past year has been at a lower 2.1 percent rate.
Texas added the most residents of any other state over the last three years (1.3 million), a fifth more than 22nd ranked California, which is nearly 50 percent larger. Texas has added 5.2 percent to its population since 2010, while California has added 2.9 percent.
Utah grew 5.0 percent, followed closely by Colorado, at 4.8 percent.
Former perennial growth leader Florida continues to recover, placing 6th, with a three year growth rate of 4.0 percent. At its present growth rate, Florida should pass New York by 2014, to become the fourth largest state. South Dakota, Washington, Arizona and Alaska rounded out the top ten.
The slowest growing states were Rhode Island (the only state to lose population since 2010), Maine, West Virginia, Michigan and Vermont. A table is attached with the data.
| States Ranked by 2010-2013 Population Change |
|
|
| Rank |
|
2010 Census |
2012 |
2013 |
Pop. Change 2010-2013 |
% Change 2012-2013 |
% Change 2010-2013 |
| 1 |
North Dakota |
672,591 |
701,345 |
723,393 |
50,802 |
3.1% |
7.6% |
| 2 |
District of Columbia |
601,723 |
633,427 |
646,449 |
44,726 |
2.1% |
7.4% |
| 3 |
Texas |
25,145,561 |
26,060,796 |
26,448,193 |
1,302,632 |
1.5% |
5.2% |
| 4 |
Utah |
2,763,885 |
2,854,871 |
2,900,872 |
136,987 |
1.6% |
5.0% |
| 5 |
Colorado |
5,029,196 |
5,189,458 |
5,268,367 |
239,171 |
1.5% |
4.8% |
| 6 |
Florida |
18,801,310 |
19,320,749 |
19,552,860 |
751,550 |
1.2% |
4.0% |
| 7 |
South Dakota |
814,180 |
834,047 |
844,877 |
30,697 |
1.3% |
3.8% |
| 8 |
Washington |
6,724,540 |
6,895,318 |
6,971,406 |
246,866 |
1.1% |
3.7% |
| 9 |
Arizona |
6,392,017 |
6,551,149 |
6,626,624 |
234,607 |
1.2% |
3.7% |
| 10 |
Alaska |
710,231 |
730,307 |
735,132 |
24,901 |
0.7% |
3.5% |
| 11 |
Wyoming |
563,626 |
576,626 |
582,658 |
19,032 |
1.0% |
3.4% |
| 12 |
Nevada |
2,700,551 |
2,754,354 |
2,790,136 |
89,585 |
1.3% |
3.3% |
| 13 |
North Carolina |
9,535,483 |
9,748,364 |
9,848,060 |
312,577 |
1.0% |
3.3% |
| 14 |
Virginia |
8,001,024 |
8,186,628 |
8,260,405 |
259,381 |
0.9% |
3.2% |
| 15 |
South Carolina |
4,625,364 |
4,723,417 |
4,774,839 |
149,475 |
1.1% |
3.2% |
| 16 |
Hawaii |
1,360,301 |
1,390,090 |
1,404,054 |
43,753 |
1.0% |
3.2% |
| 17 |
Georgia |
9,687,653 |
9,915,646 |
9,992,167 |
304,514 |
0.8% |
3.1% |
| 18 |
Delaware |
897,934 |
917,053 |
925,749 |
27,815 |
0.9% |
3.1% |
| 19 |
California |
37,253,956 |
37,999,878 |
38,332,521 |
1,078,565 |
0.9% |
2.9% |
| 20 |
Idaho |
1,567,582 |
1,595,590 |
1,612,136 |
44,554 |
1.0% |
2.8% |
| 21 |
Maryland |
5,773,552 |
5,884,868 |
5,928,814 |
155,262 |
0.7% |
2.7% |
| 22 |
Oklahoma |
3,751,351 |
3,815,780 |
3,850,568 |
99,217 |
0.9% |
2.6% |
| 23 |
Montana |
989,415 |
1,005,494 |
1,015,165 |
25,750 |
1.0% |
2.6% |
| 24 |
Oregon |
3,831,074 |
3,899,801 |
3,930,065 |
98,991 |
0.8% |
2.6% |
| 25 |
Tennessee |
6,346,105 |
6,454,914 |
6,495,978 |
149,873 |
0.6% |
2.4% |
| 26 |
Nebraska |
1,826,341 |
1,855,350 |
1,868,516 |
42,175 |
0.7% |
2.3% |
| 27 |
Massachusetts |
6,547,629 |
6,645,303 |
6,692,824 |
145,195 |
0.7% |
2.2% |
| 28 |
Minnesota |
5,303,925 |
5,379,646 |
5,420,380 |
116,455 |
0.8% |
2.2% |
| 29 |
Louisiana |
4,533,372 |
4,602,134 |
4,625,470 |
92,098 |
0.5% |
2.0% |
| 30 |
Arkansas |
2,915,918 |
2,949,828 |
2,959,373 |
43,455 |
0.3% |
1.5% |
| 31 |
Iowa |
3,046,355 |
3,075,039 |
3,090,416 |
44,061 |
0.5% |
1.4% |
| 32 |
Kansas |
2,853,118 |
2,885,398 |
2,893,957 |
40,839 |
0.3% |
1.4% |
| 33 |
New York |
19,378,102 |
19,576,125 |
19,651,127 |
273,025 |
0.4% |
1.4% |
| 34 |
Indiana |
6,483,802 |
6,537,782 |
6,570,902 |
87,100 |
0.5% |
1.3% |
| 35 |
Kentucky |
4,339,367 |
4,379,730 |
4,395,295 |
55,928 |
0.4% |
1.3% |
| 36 |
New Mexico |
2,059,179 |
2,083,540 |
2,085,287 |
26,108 |
0.1% |
1.3% |
| 37 |
New Jersey |
8,791,894 |
8,867,749 |
8,899,339 |
107,445 |
0.4% |
1.2% |
| 38 |
Alabama |
4,779,736 |
4,817,528 |
4,833,722 |
53,986 |
0.3% |
1.1% |
| 39 |
Wisconsin |
5,686,986 |
5,724,554 |
5,742,713 |
55,727 |
0.3% |
1.0% |
| 40 |
Missouri |
5,988,927 |
6,024,522 |
6,044,171 |
55,244 |
0.3% |
0.9% |
| 41 |
Mississippi |
2,967,297 |
2,986,450 |
2,991,207 |
23,910 |
0.2% |
0.8% |
| 42 |
Connecticut |
3,574,097 |
3,591,765 |
3,596,080 |
21,983 |
0.1% |
0.6% |
| 43 |
Pennsylvania |
12,702,379 |
12,764,475 |
12,773,801 |
71,422 |
0.1% |
0.6% |
| 44 |
New Hampshire |
1,316,470 |
1,321,617 |
1,323,459 |
6,989 |
0.1% |
0.5% |
| 45 |
Illinois |
12,830,632 |
12,868,192 |
12,882,135 |
51,503 |
0.1% |
0.4% |
| 46 |
Ohio |
11,536,504 |
11,553,031 |
11,570,808 |
34,304 |
0.2% |
0.3% |
| 47 |
Vermont |
625,741 |
625,953 |
626,630 |
889 |
0.1% |
0.1% |
| 48 |
Michigan |
9,883,640 |
9,882,519 |
9,895,622 |
11,982 |
0.1% |
0.1% |
| 49 |
West Virginia |
1,852,994 |
1,856,680 |
1,854,304 |
1,310 |
-0.1% |
0.1% |
| 50 |
Maine |
1,328,361 |
1,328,501 |
1,328,302 |
(59) |
0.0% |
0.0% |
| 51 |
Rhode Island |
1,052,567 |
1,050,304 |
1,051,511 |
(1,056) |
0.1% |
-0.1% |
|
United States |
308,745,538 |
313,873,685 |
316,128,839 |
7,383,301 |
0.7% |
2.4% |
I love Huy Fong Foods’ Sriracha sauce as much as the next guy, which is to say a lot. The red hot sauce with the rooster on the bottle has a cult following across the nation. So unsurprisingly it made national news when the city of Irwindale, CA sued to shut down production at the company’s processing plant there. The processing of the hot peppers, done during only a limited time of year because Huy Fong only uses fresh peppers, was alleged to be causing a noxious odor in the town.
This looks like a pretty garden variety dispute between neighbors and an industrial business. Clearly industrial odors can be a problem. I don’t know how long they’ve been in Irwindale, but Sriracha has been around a long time so I’m a bit skeptical something changed just this year. Regardless, I don’t think odor complaints are necessarily evidence of a bad business climate as there could be a legitimate problem.
Then came the state order to stop shipping the product for 30 days. The state of California decided that to reduce the risk of food borne illnesses, the sauce had to sit for 30 days before it can be shipped. Keep in mind, this is for a product that has never had a complaint against it for making someone sick.
How many businesses can afford to halt shipments for a month and survive? Sriracha has a cult following and so they’ll likely overcome it. But many businesses wouldn’t have this luxury. When their customers can’t get product, they lose the business. Indeed, I wouldn’t be surprised if restaurants do turn to alternative suppliers. At a minimum, Huy Fong is going to lose a lot of sales.
Who in their right mind would want to do business in a state like this? And this is far from the worst case. It just so happens that because this is such a popular consumer product, it’s visible. If even these types of companies get shut down, how much more so a firm where this wouldn’t create an avalanche of bad publicity?
Urbanists put way too little thought into business climate, which can sound like such a shady way of saying cut services and taxes. But taxes are often the least part of it. It’s the regulatory apparatus that makes doing business in many places too painful to contemplate. This even affects city-suburb investment patterns. I’ve observed that in many places, the urban core is a flat out terrible place to do business, unless you’re very politically wired up.
This doesn’t usually bother urbanists all that much until a trendy business they like gets affected. For example, an urban farming supply shop in Providence called Cluck got sued when they tried to open. The beautiful and the bearded were outraged and the shop was ultimately approved. But there’s no similar visibility or outrage when a Latino immigrant runs into the red-tape buzzsaw when he tries to open a muffler shop.
If we want to promote investments in our cities and states, we need to be focused on basics like an objective, predictable regulatory framework that operates in the timely fashion and in which arbitrary denials, rule changes, and such are minimized. This is way more important to attracting capital investment than sexier items like streetcar lines.
This piece first appeared at The Urbanophile.
California Superior Court Judge Michael Kenny ruled against the California High Speed Rail Authority in two decisions announced on November 25. In the first, Judge Kenny ruled that the Business Plan failed to meet the requirements of the voter approved referendum under California Assembly Bill 3034 (2008), in not identifying sufficient capital funding for the first segment. As a result, the Business Plan needs to be redrafted. In the second decision, Judge Kenny declined to issue a conformity ruling that would have paved the way for $8 billion in bonds that had been approved by voters, which were also subject to same Assembly Bill 3034.
Judge Kenny declined to stop construction of the project, which is scheduled to start in the Spring. However, the Authority only has federal funds for that segment, and which would require, in the longer run, matching state funds (which were to have been from the bonds).
According to the San Francisco Chronicle , Kenny's found that the California High Speed Rail Authority "abused its discretion by approving a funding plan that did not comply with the requirements of law."
The restoration of central city living and working environments has been one of the more important developments in the nation’s metropolitan areas over the past two decades. Regrettably, a good story has been exaggerated out of all proportion in the print, electronic and online media.
Exaggerating Core Population Increases: The rise of population in urban cores has been important, but it has too often been used to suggest the apparent, but fallacious opposite, suburban decline. In fact, the suburbs are hardly in decline, with 93.5 percent of major metropolitan area growth outside a 10 mile radius from city hall between the 2000 and 2010 censuses (See: Flocking Elsewhere: The Downtown Growth Story).
Exaggerating CBD Office Space Gains: Similar misinformation had been circulating about office space outside the nation’s CBDs (central business districts, or “downtowns”). Commercial real estate information company Costar’s Randyl Drummer recently described suburbia’s improving fortunes (See: Once Left for Dead, Suburban Office Making a Comeback).
“Some analysts wrote the obituary of the suburban office campus as downsizing companies shed millions of square feet, in many cases consolidating into buildings closer to public transit in urban centers.”
It’s just not happening, according to Costar research:
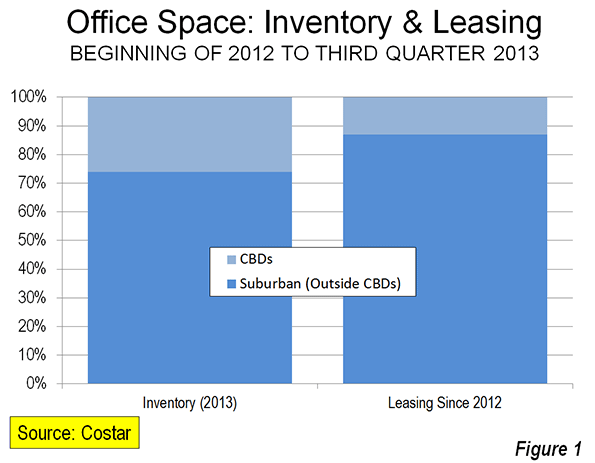
“Overall, the suburbs have garnered more than their usual share of leasing demand over the past two years, according to an analysis by CoStar real estate economists. Since the beginning of 2012, suburban markets have accounted for a whopping 87% of office demand -- which is 13% more than their 'fair share' based on the total market size compared with CBD office markets, according to data presented at CoStar’s recent third-quarter office review and forecast.”
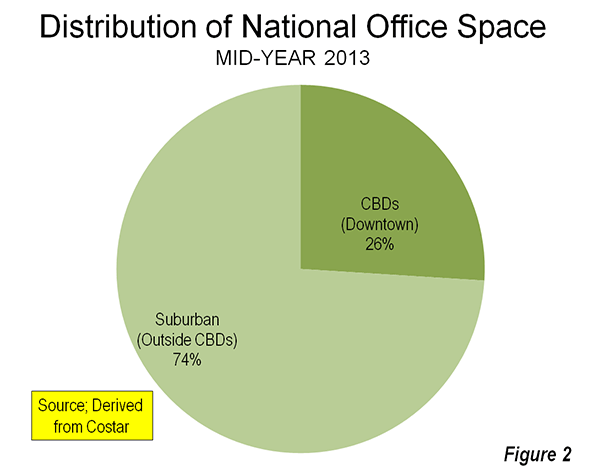
Indeed, CBD leasing, at 13 percent of the total, is a full 50 percent below their current share of inventory (Figure 1). As of mid-2013, the suburbs accounted for nearly three quarters of the nation’s office inventory (Figure 2).
Costar cites strong suburban development in Raleigh’s Research Triangle, and further notes that:
A diverse set of markets that include Sacramento, San Jose, Austin, Kansas City and Charlotte have posted some of the strongest net office absorption among suburban markets.
This is despite the glowing publicity being given to core area development, especially in places like Charlotte and Austin.
The reality is that the monumental CBD towers dominating metropolitan skylines do not indicate downtown dominance. In fact, throughout the high income world, most metropolitan employment is outside CBDs. In the United States, typically 90 percent of employment is outside the CBDs. The suburban employment (outside the CBD) share is a bit smaller in Western Europe, Canada and Australia, but still averages approximately 80 percent or more.
The good news is that neither suburbia nor downtown is dead.
Aaron Renn's recent piece on the Rust Belt has some formidable strengths that can be the foundation of its revitalization, but it has a set of structural problems that must be confronted to achieve true revitalization. Current revitalization strategies, he suggests, are outside of each city's system or fail to bring the appropriate heft to lift all those who need lifting -- largely because they only obliquely address the structural challenges. The challenges:
- Racism
- Corruption
- Closed societies
- Two-tiered environment and resulting paralysis
I won't rehash Aaron's assessment, but I do agree with it.
What occurred to me is that, if you think about it, the South's cities were in the same position following the Civil War -- and faced the same obstacles -- until after World War II. Racism clearly plagued Southern metros and hindered growth during that era; many places were well known for their corruption. The South certainly had a reputation for being a closed society, unwelcome to outsiders, and its history of reliance on low- and moderately-skilled labor made the South perhaps more skeptical of highly educated labor, just like in the Midwest.
Following World War II, however, Southern metros began to make great strides to catch up with and even surpass Northeastern and Midwestern cities. I'm no scholar on post-war Southern growth, but it appears Southern metros took on these strategies to move upward and onward:
Tolerate Newcomers. After World War II Southern cities realized that they could no longer rely on intra-region growth if they were going to prosper, particularly during a period with widespread migration of blacks to Northern cities at the time. Southern business leaders rightfully recognized opportunities to bring businesses and residents to the South from other parts of the country.
Seeing education as an asset. It's no coincidence that the Southern metros that have developed the strongest post-war economies -- Atlanta, Charlotte, Dallas, Houston, Austin, Raleigh, Nashville -- are home to significant educational institutions. After the war the colleges and universities of large Southern metros became integral to their growth.
Becoming a low-cost alternative to the rest of the country. Prior to their turnaround Southern cities probably described themselves in terms of what they lacked in comparison to Northern cities. They did not have the impressive skylines, the classic neighborhoods, the exceptional park systems or the infrastructure that were the legacy of Northern cities. However they did have cheap land and cheap labor, and those factors became the driver that facilitated the development of what they lacked.
The above strategies, combined with the widespread use of air conditioning that made the Southern climate more tolerable, allowed for the growth of Southern metros.
The Rust Belt should take note. While the South only address race as the federal government made them, perhaps the Rust Belt can become a leader in addressing race matters. If the South can learn to become more tolerant of outsiders, the Midwest can as well; it does have a legacy of immigration that can serve as a foundation. Advocates of the Rust Belt Chic movement may turn the low-cost strategy on its head -- the Rust Belt has a unique physical and social legacy that those who've grown up in places with less would welcome. And the Rust Belt has perhaps the greatest collection of public research universities in the nation (even if most are located in smaller metros and not the big cities), and they could be a huge driver of revitalization.
Clearly, the South did not get everything right. But when faced with an existential crisis not unlike what the Rust Belt faces today, they adapted. The Rust Belt must find its strengths and play to them.
|


