The pandemic has interfered substantially with the annual release of the American Community Survey (ACS). The Census Bureau indicates that “Due to the challenges of fielding a household survey during the COVID-19 pandemic, household nonresponse increased substantially in the American Community Survey, with evidence of increased nonresponse bias in many statistics.”
Fortunately, the Census Bureau went to considerable efforts to release the 2020 American Community Survey 1-Year Experimental Estimates yesterday (November 30). The Census Bureau recommends caution in comparing the data (for the nation, the states and the District of Columbia) to previous years data and we offer tentative estimates based on the assumptions below.
Our principal interest is employment access by working from home, largely because of the considerable evidence of large increases during the pandemic. These data will not match the ACS 2019 data, because only five modes are included in the experimental data (drive alone, car pool, transit, taxicabs and work from home). The ACS experimental data excludes modes such as walking, bicycles and motorcycles while this analysis does not include taxicabs.
Assumptions
In that spirit, we cautiously offer a “what if” analysis with clearly stated assumptions to provide “guesstimates” of the widely reported expansion of working at home (the largest share of remote work) during the pandemic. The tentative assumptions are that:
- In the first two months of 2020, work access modes is assumed to have had had the distribution of usual work trip access methods as was reported for the entire year of 2019. Generally, the changes in employment access that have been associated with the pandemic lockdowns in early March 2020 or later.
- Employment access shares for ten months (March through December) were assumed to be equal to the annual ACS 2020 experimental estimates minus the estimates from Assumption #1, above.
Working From Home
Tentative employment access estimates are derived based upon these assumptions, shown in Figure 1. Driving alone is estimated to have dropped 12%, car pools 14% and transit 43%. Working from home would have increased more than 210% (Figures 1 and 2).
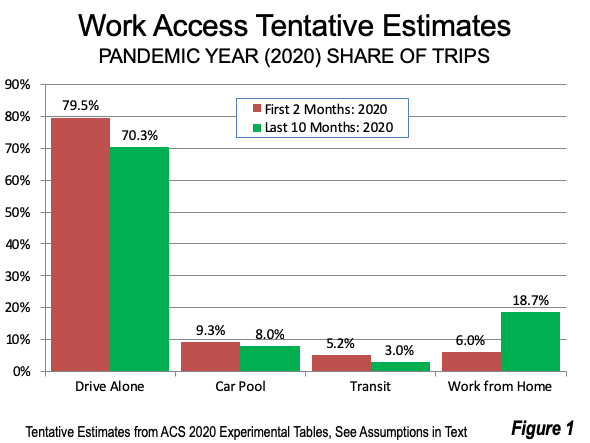
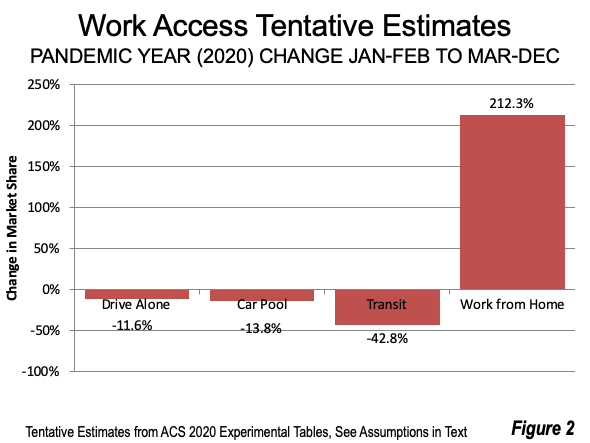
If the assumptions above were to hold, the work at home access figure for the pandemic period (March to December) would be 18.7% compared to 6.0% for the first two months (the 2019 rate).
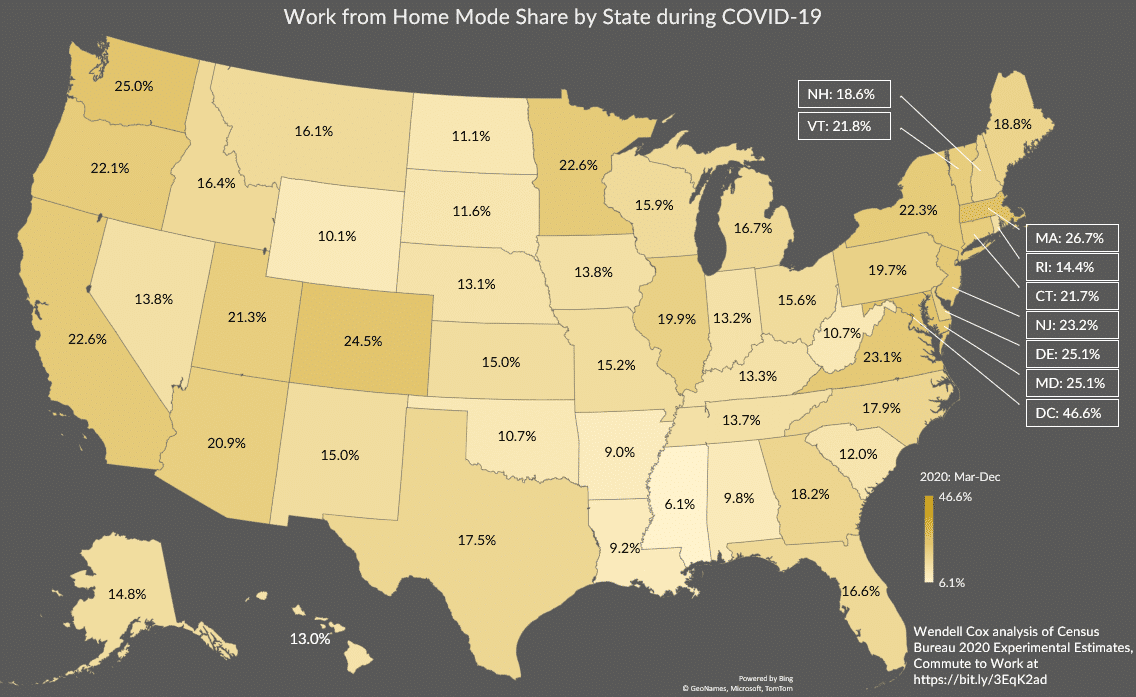
The same assumptions can be used to estimate the work from home share for the states and the District of Columbia. This data is illustrated in Figure 3, with the actual estimates shown in Table 1, below.
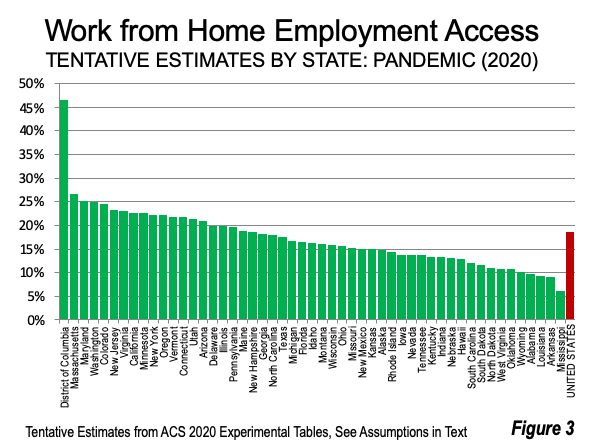
The District of Columbia would have had by far the highest work from home share, at 46.7%, almost 75% above second place Massachusetts (26.7%). The District of Columbia (Washington) results are not surprising, reflecting the huge physical commuting losses that occurred in the nation’s largest central business districts (CBDs), since their office jobs are so easily replaced by remote working. At the state/DC level, the District is by far the smallest jurisdiction and with one of the largest CBDs in the nation, a larger work at home share is not unexpected.
Nearby Maryland (estimated third at 25.1%) and Virginia (estimated seventh at 23.1%) also show high work from home shares, as many formerly Washington bound auto and transit riders worked from home instead.
The state of Washington is estimated to have ranked fourth, at 25.0% and is home to the nation’s seventh largest CBD (Seattle). Metro Seattle is one of the nation’s premier tech centers, in which many jobs can readily be done from home. Colorado is estimated to have ranked fifth, while New Jersey was sixth. Before the pandemic, New Jersey supplied many commuters to New York’s Manhattan, by far the nation’s largest CBD as well as to Center City Philadelphia, the nation’s sixth largest CBD.
The largest work from home increases from pre-pandemic to pandemic levels also occurred in the District of Columbia and Maryland. New Jersey had the third largest increase, and Maryland the fourth largest (shown in Table 1).
The Future?
The ACS data are based upon usual mode of employment access. There are indications that once the pandemic passes, many more workers will have hybrid schedules that could have them still usually at the physical work location, but working more often from home. Jose Maria Barrero (Instituto Tecnologico Autonomo de Mexico) Nicholas Bloom (Stanford University) and Steven J. Davis (University of Chicago) have reported survey data to the effect that 20% of full workdays will be from home after the pandemic. This includes the “usual” work from home access and the more hybrid arrangements that would entail fewer work at home days. Further, the National Association of Realtors notes falling office demand in major downtown areas, Further challenges to the largest and densest office markets from working at home could come from the new Omicron variant of COVID-19 and working from satellite offices.
With the pandemic effects still with us, it could take some time to obtain the reliable ACS estimates down to the lowest geographies normally reported.
Table 1 (back to reference)
| Share of Employment Access |
| TENTATIVE ESTIMATES: WORK AT HOME EMPLOYMENT ACCESS: 2020 |
| Four Modes Only (Drive Alone, Car Pool, Transit & Work from Home) |
| |
2020: Jan-Feb |
2020: Mar-Dec |
Rank |
Change |
Rank |
| Alabama |
3.5% |
9.8% |
48 |
182% |
28 |
| Alaska |
5.0% |
14.8% |
33 |
198% |
18 |
| Arizona |
7.9% |
20.9% |
15 |
164% |
33 |
| Arkansas |
3.6% |
9.0% |
50 |
149% |
39 |
| California |
6.7% |
22.6% |
8 |
238% |
13 |
| Colorado |
9.6% |
24.5% |
5 |
155% |
36 |
| Connecticut |
5.8% |
21.7% |
13 |
274% |
7 |
| Delaware |
5.3% |
20.0% |
16 |
274% |
8 |
| District of Columbia |
9.2% |
46.6% |
1 |
407% |
1 |
| Florida |
7.3% |
16.6% |
25 |
128% |
45 |
| Georgia |
7.2% |
18.2% |
21 |
153% |
37 |
| Hawaii |
5.1% |
13.0% |
41 |
152% |
38 |
| Idaho |
7.7% |
16.4% |
26 |
112% |
48 |
| Illinois |
5.7% |
19.9% |
17 |
249% |
11 |
| Indiana |
4.5% |
13.2% |
39 |
196% |
21 |
| Iowa |
6.0% |
13.8% |
35 |
129% |
44 |
| Kansas |
5.3% |
15.0% |
32 |
183% |
27 |
| Kentucky |
4.5% |
13.3% |
38 |
198% |
19 |
| Louisiana |
4.1% |
9.2% |
49 |
125% |
47 |
| Maine |
6.6% |
18.8% |
19 |
183% |
26 |
| Maryland |
5.7% |
25.1% |
3 |
337% |
4 |
| Massachusetts |
5.9% |
26.7% |
2 |
356% |
2 |
| Michigan |
4.7% |
16.7% |
24 |
257% |
10 |
| Minnesota |
6.7% |
22.6% |
9 |
235% |
14 |
| Mississippi |
3.2% |
6.1% |
51 |
92% |
49 |
| Missouri |
5.2% |
15.2% |
30 |
191% |
23 |
| Montana |
7.0% |
16.1% |
27 |
131% |
43 |
| Nebraska |
4.8% |
13.1% |
40 |
171% |
31 |
| Nevada |
5.1% |
13.8% |
36 |
170% |
32 |
| New Hampshire |
7.6% |
18.6% |
20 |
144% |
40 |
| New Jersey |
5.2% |
23.2% |
6 |
350% |
3 |
| New Mexico |
5.3% |
15.0% |
31 |
184% |
25 |
| New York |
5.2% |
22.3% |
10 |
325% |
5 |
| North Carolina |
6.9% |
17.9% |
22 |
158% |
35 |
| North Dakota |
3.8% |
11.1% |
44 |
193% |
22 |
| Ohio |
4.8% |
15.6% |
29 |
228% |
15 |
| Oklahoma |
4.6% |
10.7% |
46 |
135% |
42 |
| Oregon |
7.8% |
22.1% |
11 |
182% |
29 |
| Pennsylvania |
5.7% |
19.7% |
18 |
245% |
12 |
| Rhode Island |
4.7% |
14.4% |
34 |
205% |
16 |
| South Carolina |
5.3% |
12.0% |
42 |
127% |
46 |
| South Dakota |
6.4% |
11.6% |
43 |
81% |
50 |
| Tennessee |
5.8% |
13.7% |
37 |
136% |
41 |
| Texas |
5.9% |
17.5% |
23 |
196% |
20 |
| Utah |
7.7% |
21.3% |
14 |
176% |
30 |
| Vermont |
7.5% |
21.8% |
12 |
189% |
24 |
| Virginia |
6.0% |
23.1% |
7 |
283% |
6 |
| Washington |
6.9% |
25.0% |
4 |
263% |
9 |
| West Virginia |
4.1% |
10.7% |
45 |
162% |
34 |
| Wisconsin |
5.3% |
15.9% |
28 |
199% |
17 |
| Wyoming |
6.0% |
10.1% |
47 |
67% |
51 |
| UNITED STATES |
6.0% |
18.7% |
|
212% |
|
| Estimated from ACS 2019 and ACS 2020 Experimental Data (see text for assumptions) |
Used by permission from Inrix.com
Wendell Cox is principal of Demographia, an international public policy firm located in the St. Louis metropolitan area. He is a founding senior fellow at the Urban Reform Institute, Houston, a Senior Fellow with the Frontier Centre for Public Policy in Winnipeg and a member of the Advisory Board of the Center for Demographics and Policy at Chapman University in Orange, California. He has served as a visiting professor at the Conservatoire National des Arts et Metiers in Paris. His principal interests are economics, poverty alleviation, demographics, urban policy and transport. He is co-author of the annual Demographia International Housing Affordability Survey and author of Demographia World Urban Areas.
Mayor Tom Bradley appointed him to three terms on the Los Angeles County Transportation Commission (1977-1985) and Speaker of the House Newt Gingrich appointed him to the Amtrak Reform Council, to complete the unexpired term of New Jersey Governor Christine Todd Whitman (1999-2002). He is author of War on the Dream: How Anti-Sprawl Policy Threatens the Quality of Life and Toward More Prosperous Cities: A Framing Essay on Urban Areas, Transport, Planning and the Dimensions of Sustainability.