NewGeography.com blogs
With California State Redevelopment Agency money gone, the city of Los Angeles ought to welcome new large-scale private development, and the economic stimulus and job creation it brings, with open arms. City Hall, faced with an anemic municipal budget, could also use the increased tax revenue. One such project that would help abate the city’s budget woes and create new jobs for the city is the University of Southern California’s proposed $1.1 billion “The Village at USC” project.
Surprisingly (or perhaps not), the city’s Planning and Land Use Management Committee delayed approval of the project for the second time last week, citing a need for more time to digest data regarding the project’s gentrifying effects on the surrounding community. The city is not fooling anyone – the delay amounts to nothing short of extortion – an attempt to ensure that committee members receive their proper concessions.
The site for “The Village at USC” is located directly north of the campus on University-owned land. Currently a dilapidated retail center, the new project calls 350,000 square feet of retail and will add up to 5,200 much needed student beds. The project would also create 12,000 new jobs for the city (8,000 permanent and 4,000 construction-related).
Comprehending the short-sightedness of delaying the project requires an understanding of USC’s role in its surrounding neighborhood (full disclosure: this writer is a graduate of USC). The university was founded in 1880, when LA was nothing more than a far outpost of western American expansion. Situated just 2 miles south of downtown, the city grew outward around the campus. Once an upscale neighborhood, the area immediately adjacent to USC lost its luster with the development of the city’s Westside, including Hollywood and Beverly Hills. Post WWII suburban expansion and the construction of the 110 and 10 freeways further eroded the area.
Today the area surrounding USC’s campus is racially and economically polarized. Part of LA’s notorious South Central (now more politically correct referred to as “South LA”), the area was hard hit by the riots of 1992. Yet while crime is still an issue, the area has markedly improved since the riots. Much of the improvement is thanks to a shift in the University’s relationship to its surrounding neighborhood post-1992. Rather than continuing to see itself as an island fortress in a sea of urban chaos, USC reached out to the local community, sponsoring programs for community members and supporting local businesses. The University’s extensive community outreach efforts led it to be named TIME magazine’s “University of the Year” in 2000.
As Los Angeles developed, USC had several opportunities to relocate its campus to other parts of the city and even Orange County, but its commitment to staying in the city’s center stood the test of time. The University is the largest private employer in Los Angeles and serves as a wellspring of knowledge and talent for the city. Given these contributions to LA, it is unfortunate and even appalling that the city’s Planning and Land Use Management Committee would question the University’s intentions and delay its plans to develop on land it owns with its own money (and without any handouts from the city or state).
Adam Nathaniel Mayer is an American architectural design professional. In addition to his job designing buildings he writes the China Urban Development Blog. Follow him on Twitter: @AdamNMayer.
The Census Bureau's American Community Survey released its annual one-year snapshot of demographic data in the United States. As usual, this included journey to work (commuting data), which is summarized in the table below.
| American Community Survey Commuting Data |
| 2011, 2010 & 2000 |
|
|
|
| ESTIMATES of Total Commuters |
2000 |
2010 |
2011 |
| Drive Alone |
97.10 |
104.86 |
105.64 |
| Car/Van Pool |
15.63 |
13.27 |
13.39 |
| Transit |
5.87 |
6.77 |
6.96 |
| Bicycle |
0.49 |
0.73 |
0.78 |
| Walk |
3.76 |
3.80 |
3.89 |
| Motorcyle, Taxi & Other |
1.24 |
1.60 |
1.63 |
| Work at Home |
4.18 |
5.92 |
5.99 |
| Total |
128.28 |
136.94 |
138.27 |
| In Millions |
|
|
|
|
|
|
|
| MARKET SHARE |
|
|
|
| Drive Alone |
75.70% |
76.57% |
76.40% |
| Car/Van Pool |
12.19% |
9.69% |
9.68% |
| Transit |
4.57% |
4.94% |
5.03% |
| Bicycle |
0.38% |
0.53% |
0.56% |
| Walk |
2.93% |
2.77% |
2.81% |
| Motorcyle, Taxi & Other |
0.97% |
1.17% |
1.18% |
| Work at Home |
3.26% |
4.33% |
4.34% |
| Total |
100.00% |
100.00% |
100.00% |
|
|
|
|
| Sources: 2000, 2010 Census & 2011 American Community Survey |
Trends Since 2010
As estimated employment improved from 137.9 million in 2010 to 138.3 from 2010 to 2011, there was an increase of 800,000 in the number of commuters driving alone, which, as usual, represented the vast majority of commuting (105.6 million daily one way trips), at 76.40 percent. This was not enough, however, to avoid a small (0.17 percentage point) decline in market share.
Car pooling experienced a rare increase of 120,000 commuters, which translated into a 0.1 percentage point loss in market share, to 9.68 percent. Transit increased 190,000 commuters, and had a 0.09 percentage point increase in market share, to 5.03 percent. This brought transit's market share to above its 2008 share of 5.01 percent and near its 1990 market share of 5.11 percent.
Working at home increased by 70,000, with a modest 0.1 percentage point increase from 2010.
Trends Since 2000
Even with declining falling household incomes and rising gasoline prices, single-occupant commuting continued to rise between 2000 and 2011. Solo drivers increased nearly 8 million, more than the total transit commuting in 2011. Car pooling continued its long-term decline, falling 2.2 million. Transit did well (as would be expected with unfavorable economic conditions and unprecedented gasoline price increases), as we noted last year, having added 1.1 million commuters. This was spread thinly around the country, though with a 70 percent concentration in New York and Washington, DC. Over the period, working at home experienced an increase of 1.8 million, the largest increase outside solo driving.
Media Attention
For the most part the commuting data was ignored by the media --- and for good reason. The one year changes were predictably modest. However, the exception was USA Today, with a top of the webpage "Fewer Americans Driving Solo" headline. In fact, as noted above, the short term and long term trends reflected an increase in solo driving. Moreover, reading the story it would be easy to get the impression that a sea change had occurred in how people get to work. To its credit, however, USA Today appropriately labeled the likely reasons for the mountains it made into molehills --- the economy and gasoline prices.
The Democratic Party in Chicago is at war. The one party town is seeing an important element of the coalition on strike. Rahm Emanuel is at war with a real adversary: teacher’s union boss Karen Lewis. Last year Lewis began laying the groundwork for a strike as witnessed in this Chicago Magazine interview with reporter Carol Felsenthal:
CF: So you have an issue with [Secretary of Education, former CPS CEO] Arne Duncan?
KL:Yeah, because he has a bachelor’s in sociology from Harvard and played basketball [he’s an education expert]? I think he’s completely and totally unqualified to do this job. And to me, it’s sort of indicative of how education is such a political tool now, as opposed to [his] having a real bent toward education. I think this is a way for Obama to try to make an olive branch with Republicans. There’s this mentality that outsiders and people with no education background are the… experts…. They want to privatize public education…. Arne’s policies here were a disaster.
Karen Lewis, like Rahm Emanuel, isn’t shy about expressing her opinions. Conflict is in the air. For 25,000 teachers to be on strike weeks before a Presidential election is a major problem for Barack Obama and Rahm Emanuel. Karen Lewis has even organized children to chant slogans against Rahm Emanuel. As veteran Chicago reporter Greg Hinz has said:
Mr. Emanuel has loudly declared what he wants, issued his demands in what I hear was an f-bomb-filled meeting with Ms. Lewis, and moved to impose some items by fiat — i.e., enacting a longer school day and directing the board to rescind a negotiated 4 percent pay hike.
Chicago is running out of money. There’s much blame to go around. The financial math is a threat to the status quo. The public school system has been a lucrative racket for some. Chicago Tribune columnist John Kass explains:
Unfortunately, the system works just fine. It works for the teachers union that wins the big raises (the current offer: a 16 percent bump over the next four years) and for the bureaucrats who are creatures of patronage, and for the vendors who feed from the almost $6 billion budget.
It works for Democratic politicians. They increase property taxes to pay for union raises and, in exchange, receive union support and political donations in election years. It's been going on that way for years.
But does it work for the kids? Not when nearly half don't graduate.
As New Geography readers remember, we warned that Chicago was on the downswing. The 2010 Census confirmed this decline. The difficult part of decline is the hardship that comes with layoffs. University of Chicago Professor Tim Knowles says 5000 Chicago Public School teachers could lose their jobs because of 100 schools may shut. When you lose 6.9% of your population in 10 years, closures are inevitable.
In conclusion, Karen Lewis has picked a perfect time to strike: right before a Presidential election. The Democratic party needs all the help it can get from unions to get out the vote in nearby battleground states. What if they don’t get out the vote in Ohio and other unions strongholds in November?
In a recent Evolving Urban Form article, we speculated that Tokyo, the world's largest urban area (population more than 35 million) could be displaced by fast-growing Jakarta or Delhi as early as 2030. If the prediction of central jurisdiction administrators and academics come true, Tokyo could be passed by many other urban areas in population by 2100.
The Japan Times reports forecasts that the population of the Prefecture of Tokyo, the central jurisdiction of the metropolitan area, could decline by nearly 50 percent (chart) between 2010 and 2100 (Note). Yet, while the overall population is dropping in half, the elderly population would increase by more than 20 percent. The resulting far less favorable ratio of elderly to the working population would present unprecedented social and economic challenges.
The article provides no information on the population of the entire urban area in 2100. The Prefecture of Tokyo constitutes somewhat over one third of the present population of the urban area.
During the last census period (between 2005 2010) the four prefecture Tokyo metropolitan area (Tokyo, Kanagawa, Saitama and Chiba), gained approximately 1,100,000 new residents, while the balance of the country was losing 1,400,000 residents. Japan is forecast to suffer substantial population losses in the decades to come. The United Nations forecasts that its population will decline from approximately 125 million in 2010 to 90 million in 2100. This is the optimistic scenario. The National Institute of Population and Social Security Research forecasts a drop to under 50 million, a more than 60 percent population reduction.
There are serious concerns about the projected population decline. According to the Japan Times, the researchers said that " ... it will be crucial to take measures to turn around the falling birthrate and enhance social security measures for the elderly," A professor the National Graduate Institute for Policy Studies, expressed concern that "If the economies of developing countries continue growing, the international competitiveness of major companies in Tokyo will dive."
----
Note: the Prefecture of Tokyo government is called the Tokyo Metropolitan Government. This term can mislead, because the prefecture itself is not the metropolitan area, but only part of the four prefecture metropolitan area. The pre-– amalgamation predecessor of the current city of Toronto was called the Municipality of Metropolitan Toronto. Like the Prefecture of Tokyo, the Municipality of Metropolitan Toronto comprised only part of the Toronto metropolitan area. Confusion over these terms not only resulted in incorrect press reports, but even misled some academic researchers to treat these sub-metropolitan jurisdictions as metropolitan areas.
In an article entitled Fourth Time Unlucky, The Economist wonders why Brazil, with "a long list of more worthwhile infrastructure projects", does not dismiss high speed rail "out of hand."
After three unsuccessful attempts to attract international bidders to build its Rio de Janeiro to Sao Paulo and Campinas line for a bargain basement price, the nation has decided that taxpayers will foot some (probably all) of the bill.
The Economist continues:
"Everywhere, new-build rail projects are horribly likely to come in way over budget and to be used much less than expected. A 2009 paper by Bent Flyvbjerg of Oxford’s Saïd Business School, ominously entitled "Survival of the Unfittest: Why the worst infrastructure gets built—and what we can do about it."
As Flyvbjerg and others have noted, promoters, whether private or public, often seem to have a simple goal: to get the line under construction. That positions the projects for taxpayer bailouts when they run into problems.
With bidders able to call upon other people's money (taxpayer's money) this time, it seems likely there will be takers. And, based upon the experience with major infrastructure projects around the world, that will be just the start of the taking.
If elsewhere provides any guidance, the winning bidder can be confident that, down the road, the captive customer (the taxpayers) will pay any cost overruns. At the same time, the routine could be repeated in which a government kicks and screams, claiming it had no warning.
They did. In this day and age, a link to the Economist's warning is forever. A wise government will obtain the unlimited guarantees any company involved in the winning joint venture. Only then will Brazil's taxpayers be protected.
The Central Japan Railway (Note 1), which operates one of only two high-speed rail segments (Tokyo Station to Osaka Station) in the world that has been fully profitable (including the cost of building), proposes to build a line from Dallas to Houston, with top speeds of 205 miles per hour. This is slightly faster than the fastest speeds now operated. This line is radically different from others proposed around the nation and most that have been proposed around the world. The promoters intend to build and operate the route from commercial revenues.
 There is the understandable concern that eventually, the promoters will approach the state or the federal government for support. Not so, say Texas Central High Speed Railway officials. According to President Robert Eckels, not only is there no plan for subsidies, but "investors would likely walk away from a project that couldn’t stand on its own." He also told the Texas Tribune “If we start taking the federal money, it takes twice as long, costs twice as much,” Eckels said. “My guess is we’d end up pulling the plug on it.” There is the understandable concern that eventually, the promoters will approach the state or the federal government for support. Not so, say Texas Central High Speed Railway officials. According to President Robert Eckels, not only is there no plan for subsidies, but "investors would likely walk away from a project that couldn’t stand on its own." He also told the Texas Tribune “If we start taking the federal money, it takes twice as long, costs twice as much,” Eckels said. “My guess is we’d end up pulling the plug on it.”
Eckels is a former Harris County Judge (Houston), a position the equivalent of a county commission or county board of supervisors chair in other parts of the nation. Eckels developed a reputation for fiscal responsibility during his tenure at the county courthouse.
The Texas project is in considerable contrast the California High Speed Rail project, which if built, is likely to require a 100 percent capital subsidy and perhaps subsidies for operations. It is also different from the Tampa to Orlando high speed rail project, which would have required a 100 percent capital subsidy and was cancelled by Florida Governor Rick Scott. The Texas project can also be contrasted with the Vegas to Victorville, California XpressWest high speed rail line that would require at least a $5.5 billion federal loan and a subsidized interest rate. Our recent Reason Foundation report predicted that XpressWest would not be able to repay its federal loan from commercial revenues and could impose a loss on federal taxpayers of up to 10 times the Solyndra loan guarantee loss (see The Washington Post, "Solyndra Scandal Timeline").
From the horrific record of private investment in startup high speed rail lines and the huge losses that have been typical, I am certainly skeptical. The Taiwan high speed rail private investors have lost two-thirds of their capital investment and debts are guaranteed by the government. The Channel Tunnel rail line to St. Pancras station has been bailed out by British taxpayers. However, if any company can make money at high speed rail in the United States, it would be the Central Japan Railway.
So far the Texas Central High Speed Railway seems to be doing it right. Like the other intercity modes, the airlines system and the intercity highway system (Note 2), this project would be paid for by people who use it.
Without government subsidies or loans, the Texas Central High Speed Railway will certainly have an incentive to get the sums right. If they are not, it sounds like the plug will be pulled. If they are, high speed rail could be on the right track in the United States for the first time. More power to them.
------
Note 1: Central Japan Railway, and other companies purchased the assets of the Japanese National Railway in the late 1980s. The nationalized railway had run up a debt of nearly $300 billion, which was eventually transferred to taxpayers.
Note 2: There is a small subsidy to the airline system from the Federal Aviation Administration. Intercity highways have been financed by users until contributions from the federal general fund in recent years. However these contributions have been far less than diversions over the past 30 years from highway user fees, principally to mass transit a major transfer of highway trust fund interest to the general fund and now ongoing interest transfers.
Photograph: Central Japan Railway corporate headquarters at Nagoya Station (by author)
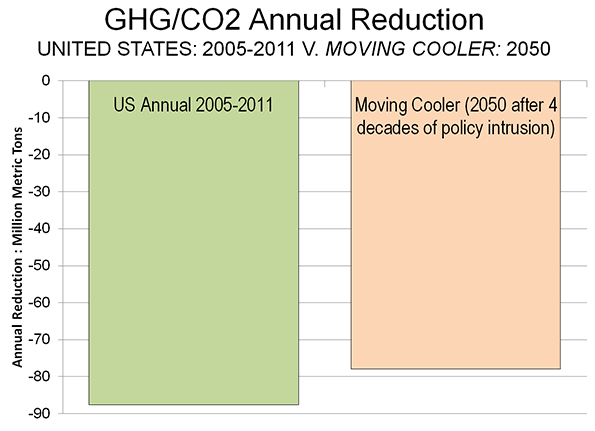
Congratulations to America. According to the US Department of Energy, Energy Information Administration, carbon dioxide (CO2) emissions were reduced 526 million tons from 2005 to 2011. This is no small amount. It is about the same as all the CO2 emissions in either Canada or the United Kingdom. Only five other nations emit more than that.
The bigger news is that this was accomplished without any of the intrusive behavioral modification proposed by planners, such as by California's anti-detached housing restrictions, Plan Maryland, or the state of Washington's mandatory driving reduction program.
Of course, part of the national reduction was due to the economic difficulties since 2005. However, even with 1.8 percent gross domestic product growth in 2011, EIA shows that CO2 emissions fell 2.4 percent in 2011.
The magnitude of the decline over six years is impressive. Actual GHG/CO2 emissions were reduced more annually between 2005 and 2011 than smart growth proponents claim for their strategies after 45 years of draconian policy intrusions.Modeled smart growth forecasts in Moving Cooler's middle scenario (by Cambridge Systematics and the Urban Land Institute) show the annual GHG/CO2 emission reduction in 2050, calculated from 2005, to be less than the emissions reduction in the average year between 2005 and 2011.
This is despite what would be four decades of trying to force people to live where they don't want, in housing they don't prefer, while trying to drive them out of the cars that required to sustain economic growth in modern metropolitan areas.
Moving Cooler's forced densification and anti-automobile strategies were so radical that the Transportation Research Board authors of Driving and the Built Environment, could not agree that a similar approach was feasible, because it would be prevented by public resistance to the personal and political intrusions (Note 1). They would also be hideously expensive, as the Moving Cooler authors ignored the much higher costs of housing associated with smart growth's behavioral strategies.
This comparison demonstrates the conclusion of a recent Cambridge University (United Kingdom) led study (see "Questioning the Messianic Conception of Smart Growth", which stated:
In many cases, the potential socioeconomic consequences of less housing choice, crowding, and congestion may outweigh its very modest CO2 reduction benefits.
Government policies have had little to do with the reductions, except to the extent that they precipitated the greatest economic downturn since the Great Depression (such as by encouraging loose lending standards and the smart growth housing policies that drove house prices up so much that the housing bust became inevitable).
Market forces have made a substantial contribution to the reduction. There was a substantial shift to the use of natural gas from coal, a conversion that is really only starting. There was also a modest improvement in automobile fuel efficiency (though much more is to come).
In 2007, the McKinsey Corporation and The Conference Board published a study (co-sponsored by the Environmental Defense and the Natural Resources Defense Council), which said that sufficient GHG emissions reductions (Note 2) could be achieved without driving less or living in more dense housing. Our more recent Reason Foundation report showed that the potential for GHG emission reduction from more fuel efficient cars and carbon neutral housing far outweighed any potential for reductions from smart growth's behavior modification.
------
Note 1: Transport consultant Alan E. Pisarski evaluated Moving Cooler in an article entitled ULI Moving Cooler Report: Greenhouse Gases, Exaggerations and Misdirections.
Note 2: Most of GHG emissions are CO2.
Jim Russell pointed me at an interesting article about densification vs. de-densification over at the Urbanization Project at NYU Stern. It contains this very interesting map of the change in census tract densities in Manhattan over the century between 1910 and 2010:

Walking Related Commutes
Streetsblog, in an article covering the annual NYC DOT scorecard, included this graphic of the percentage of commutes that include walking as a core component (e.g, transit) in various parts of New York:

This post originally appeared at The Urbanophile.
Der Speigel reports that Germany's rushed program to convert to renewable energy is already imposing an economic burden. Part of the problem is the inherent instability of power produced by renewable sources such as wind and solar:
The problem is that wind and solar farms just don't deliver the same amount of continuous electricity compared with nuclear and gas-fired power plants. To match traditional energy sources, grid operators must be able to exactly predict how strong the wind will blow or the sun will shine.
A national energy expert said:
"In the long run, if we can't guarantee a stable grid, companies will leave (Germany). "As a center of industry, we can't afford that."
An important principle of the international impetus to reduce greenhouse gas emissions is that there be little or no economic loss. Certainly, an industrial powerhouse like Germany cannot subject itself to such risks.
At the same time, other locations would be similarly threatened by implementation of renewable power mandates whose "time has not yet come." Not only is there the potential to inflict economic harm on industry (and consumers through higher prices), but higher electricity prices would reduce discretionary incomes and could lead to greater poverty rates. The eradication of poverty has recently been declared to be a virtual prerequisite to sustainability at the Rio conference.
eradicating poverty should be given the highest priority, overriding all other concerns to achieve sustainable development.
Environmental sustainability requires economic sustainability. A litany of failures could do serious damage to GHG emission reduction efforts.
I had the pleasure of participating on Jerry Agar's program on Newstalk 1010 in Toronto, with host Tasha Kheiriddin on August 15. The subject was a new report by the David Suzuki Foundation lauding the benefits of Toronto's greenbelt greenhouse gas (GHG) emission reduction role as a carbon sink.
Ms. Kheiriddin was interested in the other side of the issue, which I was happy to summarize. First and foremost, for all of their claimed benefits, greenbelts around growing cities have serious consequences. They force population densities up, which makes traffic more congested. This is because as densities rise, traffic volumes increase. There are various estimates of the increase in traffic congestion from a doubling of density, from (for example) 61 percent (Sierra Club) to 96 percent (Ewing and Cervero). The greater congestion produces more intense local air pollution, with the predictable health effects. Beyond that, as any Economics 101 student should know, rationing anything (such as land) tends to be associated with higher prices. It is no wonder that house prices have skyrocketed since the greenbelt was established.
It is important to understand the dynamics of GHGs. It doesn't matter whether they occur in the Toronto greenbelt or Patagonia. This means that there is no reason for GHG reduction to emanate from the Toronto greenbelt. It would be far better to forest some of the 7.5 million acres of disused farmland in Ontario (since 1951). This is many times as much land as the Toronto greenbelt. In other words, from a global (or local GHG emission perspective), the Toronto greenbelt is irrelevant (Note).
The purpose of the city (metropolitan area) should be to facilitate higher discretionary incomes for its residents, while minimizing poverty, all within the constraints of sufficient environmental protection. The greenbelt reduces discretionary incomes by restricting mobility (more traffic congestion) and raising house prices. It increases poverty by raising costs and preventing job creation. The greenbelt's claimed GHG emission benefits can readily be replaced by strategies elsewhere that do not reduce economic growth.
Note: Large portions of the farmland in Ontario and Quebec have been taken out of production since 1951, as production has been transferred to the Prairie provinces (Alberta, Saskatchewan and Manitoba). Meanwhile, the real value of agricultural production in Canada increased 160 percent from 1961 to 2005.
|


