New Yorkers like to think of themselves as ahead of the curve but, this year, they seem to be embracing the most regressive politics. The overwhelming favorite in Tuesday’s primary among Republican candidates – with more than 50 percent support, according to RealClearPolitics – is Donald Trump, the brash New Yorker whose campaign vows to “make America great again.” On the Democratic side, New Yorkers appear to prefer Hillary Clinton, their former U.S. senator and quintessential avatar of the gentry liberals, rather than feeling “the Bern.” read more »
Demographics
Empire State Building Toward Wins for Trump, Hillary
- Login to post comments
Largest Cities in the World: 2016
Tokyo-Yokohama continues to be the largest city in the world, with nearly 38 million residents, according to the just released Demographia World Urban Areas (12th Annual Edition). Demographia World Urban Areas (Built-Up Urban Areas or Urban Agglomerations) provides annual estimates of the population, urban land area and urban population density of all identified built-up urban areas in the world. This year's edition includes 1,022 large urban areas (with 500,000 or more residents), with a total population of 2.12 billion, representing 53 percent of the world urban population. read more »
- Login to post comments
Moving to the Middle: Domestic Migration by Metropolitan Area Size
Americans are moving to middle-sized metropolitan areas, according to the latest Census Bureau population estimates. Between 2010 and 2015, all of the domestic migration gain was in a broadly defined middle of metropolitan areas between 250,000 and 5,000,000. Both above and below that range there were huge domestic migration losses. read more »
Aristocracy of Talent: Social Mobility Is the Silver Lining to America’s Inequality Crisis
Yes, wealth concentration is insane. But the ways in which wealth is shifting are surprising—and give reason for a little optimism.
In an age of oligarchy, one should try to know one’s overlords—how they made their money, and where they want to take the country. By looking at the progress of the super-rich --- in contrast with most of us --- one can see the emerging and changing dynamics of American wealth. read more »
- Login to post comments
Population Growth in the Largest Counties: Texas, Florida and the South
As last week's US Census Bureau population estimates indicated, the story of population growth between 2014 and 2015 was largely about Texas, as it has been for the decade starting 2010 (See: “Texas Keeps Getting Bigger” The New Metropolitan Area Estimates). read more »
- Login to post comments
The Sun Belt Is Rising Again, New Census Numbers Show
From 2009-11, Americans seemed to be clustering again in dense cities, to the great excitement urban boosters. The recently released 2015 Census population estimates confirm that was an anomaly. Americans have strongly returned to their decades long pattern of greater suburbanization and migration to lower-density, lower-cost metropolitan areas, largely in the South, Intermountain West and, most of all, in Texas. read more »
- Login to post comments
The Relationship Between Fertility and National Income
We all heard that “demography is destiny”. But how many of us truly believe it? read more »
- Login to post comments
“Texas Keeps Getting Bigger” The New Metropolitan Area Estimates
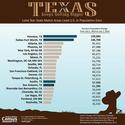
The United States Census Bureau has just released its 2015 population estimates for metropolitan areas and counties. Again, the story is Texas, with the Bureau’s news release headline reading: Four Texas Metro Areas Collectively Add More Than 400,000 People in the Last Year. The Census Bureau heralded the accomplishment with a ”Texas Keeps Getting Bigger” poster, which is shown below. The detailed data is in the table at the bottom of the article. read more »
- Login to post comments
Farewell, Grand Old Party
The increased likelihood of Donald Trump as the GOP presidential nominee, as evidenced by his win in Florida and other states last week, spells the end of the Republican Party as we have known it. Successful political parties unite interests under a broadly shared policy agenda. The Clinton Democrats may seem ethically challenged, condescending and bordering on dictatorial, but they share basic positions on many core issues and a unifying belief in federal power as the favored instrument for change. read more »
- Login to post comments
Japan Census 2015: Decline Less than Projected
Headlines were recently made recently as Japan finally experienced a long predicted official decline in population. This is widely expected to be the beginning of a long decline in population, which the National Institute of Population and Social Security Research has projected will drop Japan’s population from its present 127 million to 43 million by 2100 (Chart). read more »
- Login to post comments


