The Dallas-Fort Worth metropolitan area (Note 1), which corresponds to the Dallas-Fort Worth urban area, provides a casebook example of expanding urbanization. Dallas-Fort Worth has been one of the fastest growing major metropolitan areas in the nation for decades. Dallas-Fort Worth was among only three US metropolitan areas adding more than 1,000,000 residents between 2000 and 2010. Only Houston's addition of 1,230,000 exceeded that of Dallas-Fort Worth, which grew by 1,210,000, a 23.4 percent growth rate. Atlanta was the third metropolitan area to add more than one million residents, at 1,021,000. During the 2000s, Dallas-Fort Worth passed Philadelphia to become the nation’s fourth largest urban area, with a population of 6,372,000. Only New York, Los Angeles and Chicago are larger.
On an international scale, the United Nations estimates indicate that only Singapore, Houston and Atlanta had greater percentage growth between 2000 and 2010 among high-income world urban areas that exceed 4,000,000 in population.
The Core: The core of the metropolitan area experienced the earliest growth and has since seen its share of growth and its growth rate decline significantly. Dallas County, which includes the historical core municipality of Dallas (Note 2), had a growth rate of 6.7 percent between 2000 and 2010, approximately one third less than the national growth rate of 9.7 percent. Nearly all of the growth in Dallas County was outside the city of Dallas, which added only 0.8 percent to its population, less than one-tenth of the national rate. The city of Dallas added 9,000 residents, while the suburbs within Dallas County added 140,000 residents.
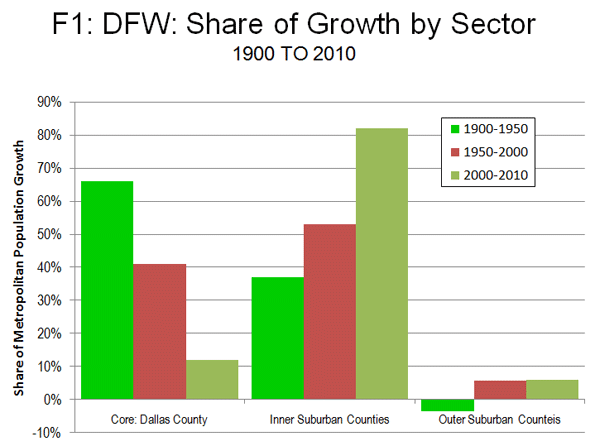
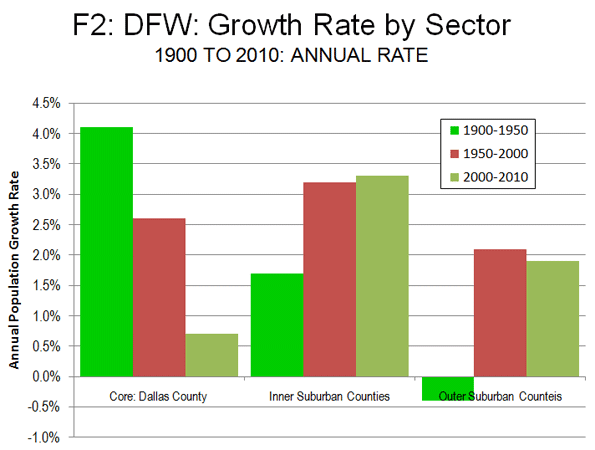
Overall, Dallas County accounted for 12 percent of the metropolitan area’s growth between 2000 and 2010. This is down from 41 percent between 1950 and 2000. Between 1900 and 1950, Dallas County accounted for an even larger share (66 percent) of growth (Figure 1). Dallas County's annual growth rate fell from 4.1 percent between 1900 and 1950 to 2.6 percent between 1950 and 2000 to 0.7 percent in the last decade (Figure 2).


Inner Suburban Counties: During the 2000s, the greatest growth was experienced in the inner suburban counties (those abutting the core county, Dallas). These six counties (Collin, Denton, Ellis, Kaufman, Rockwall and Tarrant, where Fort Worth is located) experienced a population gain of 38.9 percent. Inner suburban counties now contain 56 percent of the metropolitan area population. Between 2000 and 2010, the inner suburban counties captured 82 percent of the metropolitan area, up from 53 percent between 1950 and 2000 and 38 percent between 1900 and 1950. The inner suburban counties grew 1.7 percent annually from 1900 to 1950, increasing to 3.2 percent between 1950 and 2000 and 3.3 percent in the 2000s.
Outer Suburban Counties: The outer suburban counties represent a comparatively small portion of the metropolitan area’s population. These five counties (Delta, Hunt, Jasper, Parker and Wise) accounted for only 7 percent of the metropolitan area population. The 2000 to 2010 growth rate was 20.9 percent, somewhat below the metropolitan area rate of 23.4 percent, and more than double the national population growth rate of 9.7 percent national growth rate.
Between 2000 and 2010, the outer suburban counties captured 6 percent of the metropolitan area growth, the same share as between 1950 and 2000. However, perhaps surprisingly, their combined 1950 population was 19 percent below that of 1900. This illustrates the declining fortunes in the early part of the 20th century of counties that were dominated by agriculture, as the farm population and population of many small farm dependent communities declined. Of course, the 1900 to 1950 losses have since been compensated many times over by the post 1950 suburbanization. Nonetheless, one outer suburban county, Delta is unique in continuing to lose population through the 2010 census. Delta County’s 2010 population of 5,200 is approximately one third of its 1900 population of 15,200.
The outer suburban counties lost 0.4 percent of their population annually from 1900 to 1950, but turned around to gain 2.1 percent from 1950 to 2000. Between 2000 and 2010, the growth rate fell back to 1.9 percent.
The City of Dallas: The historical core municipality of Dallas illustrates of the dynamics of aggressive annexation policies. In 1910, Dallas covered only 16 square miles (41 square kilometers) and had a population of 92,000. Even at this early date, the city of Dallas was not very dense, with 5,700 residents per square mile (2,200 per square kilometer). The city reached its peak density of 7,300 (2,800 per square kilometer) in 1940, after having expanded to 41 square miles (106 square kilometers) and a population of 295,000.. Even at this peak density, the city of Dallas remained well below the densities of other core cities, especially in the East and Midwest, most of which had densities exceeding 10,000 per square mile (3,900 per square kilometer).
By 1950, the city had expanded to 112 square miles (289 square kilometers) and with a population of 334,000, the population density had fallen to 3,900 (1,500 per square kilometer). Larger annexations were to follow, with the city reaching 343 square miles (885 square kilometers) by 2010. With a population of 1,198,000, the population density was 3,500 per square mile (1,350 per square kilometer), less than one-half the 1940 peak. Virtually all new owned housing was built consistent with the post-World War II suburban form, as occurred in metropolitan areas around the nation. The city's addition of 9,000 residents between 2000 and 2010 was far less than the 182,000 gain between 1990 and 2000. By 2000, there was little greenfield land left to develop in the city and the population could be peaking. Indeed, the population could decline in future censuses, as has happened in geographically constrained urban cores around the world. Any such decline could, however, be counteracted by immigration, as has occurred in some urban cores.
Ethic Trends in the Metropolitan Area: As would be expected in a state bordering Mexico, the Latino population of Dallas-Fort Worth grew substantially between 2000 and 2010, at a 43 percent rate. Overall, Latinos accounted for 42 percent of the metropolitan area's growth. The Latino population increase was nearly 520,000, more people than live in the core city of Atlanta.
However, unlike a number of other metropolitan areas, there was strong growth in the African-American population, which added 33 percent to its count. African-Americans accounted for 19 percent of the metropolitan area's growth.
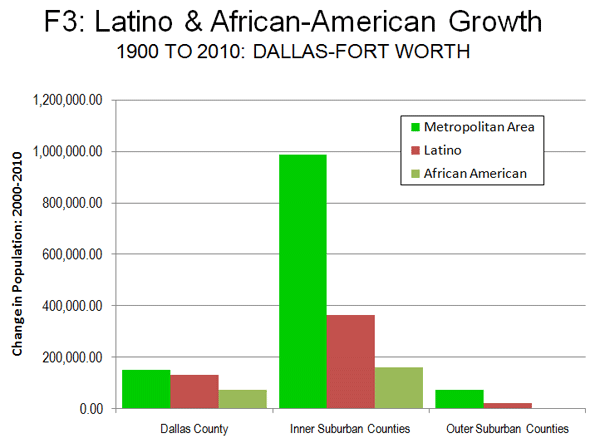
This growth was strongest in the core county of Dallas, where Latino and African-American growth made up for a decline in the rest of the population. In the inner suburban counties, 53 percent of the growth was Latino or African-America, while the lowest share of Latino and African American growth was in the outer suburban counties, at 30 percent.
Overall, 75 percent of Latino growth and 69 percent of African-American growth took place in the suburban counties, which is a substantial change from the past (Figure 3).

The Urban Area: Urban area data has not been released from the 2010 census. However, it is clear that Dallas-Fort Worth has become less dense since 1950. Between 1950 and 2000, the population density of the urban area declined approximately 10 percent. Even so, it is surprising to some that the Dallas-Fort Worth urban area, with its low-density reputation, was only 12 percent less dense that Portland urban area in 2000, despite the aggressive densification strategies employed by Portland.
The Expanding Metropolitan Area: The story in Dallas-Fort Worth is little different (Table) from what has emerged in metropolitan areas around the world, in places like Seoul, Mexico City and Mumbai. Dallas-Fort Worth also illustrates a trend only now becoming more obvious, that middle-sized and smaller metropolitan areas are generally growing faster than the megacities within their own countries (see the report by the McKinsey Global Institute). The United States has two megacities, the New York metropolitan area, which grew 3.1 percent from 2000 to 2010 and Los Angeles, which grew 3.7 percent. Dallas-Fort Worth's far higher growth rate of 23.4 percent translated into an actual population increase of 175,000 more than the combined increase of the two megacities, despite their having five times the population.
| Dallas-Fort Worth: Population Trend by Sector and County | ||||
| 1900-2010 | ||||
| 1900 | 1950 | 2000 | 2010 | |
| CORE COUNTY | ||||
| Dallas County | 82,756 | 614,799 | 2,218,899 | 2,368,139 |
| INNER SUBURBAN COUNTIES | 222,747 | 527,281 | 2,596,623 | 3,585,286 |
| Collin County | 50,087 | 41,692 | 491,675 | 782,341 |
| Denton County | 28,318 | 41,365 | 432,976 | 662,614 |
| Ellis County | 50,059 | 45,645 | 111,360 | 149,610 |
| Kaufman County | 33,376 | 31,170 | 71,313 | 103,350 |
| Rockwall County | 8,531 | 6,156 | 43,080 | 78,337 |
| Tarrant County | 52,376 | 361,253 | 1,446,219 | 1,809,034 |
| OUTER SUBURBAN COUNTIES | 149,302 | 120,754 | 346,022 | 418,348 |
| Delta County | 15,249 | 8,964 | 5,327 | 5,231 |
| Hunt County | 47,295 | 42,731 | 76,596 | 86,129 |
| Johnson County | 33,819 | 31,390 | 126,811 | 150,934 |
| Parker County | 25,823 | 21,528 | 88,495 | 116,927 |
| Wise County | 27,116 | 16,141 | 48,793 | 59,127 |
| METROPOLITAN STATISTICAL AREA | 454,805 | 1,262,834 | 5,161,544 | 6,371,773 |
The Future? It is an open question whether the rapid growth of Dallas-Fort Worth will continue. As it continues to grow, the stagnation that now afflicts the nation's two megacities and its near-megacity, Chicago could spread to Dallas-Fort Worth. On the other hand, Dallas-Fort Worth has advantages that could permit its growth to continue for multiple decades into the future. Texas has a favorable business climate, low taxes and less heavy handed regulation than New York, California and Illinois. Dallas-Fort Worth has plenty of developable land as well as a political culture not cowed by development. The economic advance of its growing population, particularly the burgeoning Latino population, depends upon public policies that favor housing affordability and urban expansion. If it continues on its current course, Dallas-Fort Worth could pass the Chicago metropolitan area in population by 2050 and could even challenge Los Angeles later in the century.
----
Note 1: As currently defined by the Census Bureau. Officially titled the Dallas-Fort Worth-Arlington metropolitan statistical area. Metropolitan areas are essentially labor markets and include a principal urban area and rural (non-urban) areas and may include smaller urban areas.
Note 2: Fort Worth is not considered a historical core municipality, based upon the discussion in Perspectives on Urban Cores and Suburbs, though the Census Bureau considers Fort Worth and Arlington to be principal cities (which are a different thing). The "Dallas-Fort Worth" terminology is used because of its wide acceptance and to make the geographical expanse of the metropolitan area more clear.
Wendell Cox is a Visiting Professor, Conservatoire National des Arts et Metiers, Paris and the author of “War on the Dream: How Anti-Sprawl Policy Threatens the Quality of Life”
Photo by Trey Ratcliff


