The world’s developing economies have dominated purchasing power economic growth over the last 35 years, according to the most recent gross domestic product (GDP-PPP) per capita data from the International Monetary Fund (IMF). This article summarizes economic growth for three periods, including from the earliest IMF data (1980 to 2015), the intermediate 2000 to 2015 period and the more recent 2010 to 2015 timeframe. The full data is available on the Demographia website, at http://www.demographia.com/db-imf2015.pdf.
GDP per capita provides a measure of comparative income for individuals in an economy, as opposed to overall GDP data, which is a measure of an economy’s total production. This is an important distinction, because an economy may have a very high overall GDP, while its residents have relatively low income. For example, India has the world’s fourth largest GDP, yet with its population approaching 1.3 billion, ranks 126th in GDP per capita (out of the 190 countries and sub-national geographies included in the database). On the other hand, China’s Macao Special Administrative Region has the third highest GDP per capita in the world, but barely manages to be within the 100 largest economies, due to its much smaller population (approximately less than 600,000).
Fastest Growing Economies
2010-2015: The most recent period exhibited remarkable geographic diversity among the fastest growing economies. Asia contributed 13 entries out of the top 20, with Africa adding three (Ethiopia, Ghana and the Democratic Republic of the Congo), Europe two (Latvia and Lithuania), Oceana one (Papua New Guinea) and North America one (Panama). The fastest growing economy was Turkmenistan, at 67 percent, closely followed by Mongolia at 63 percent and Ethiopia at 61 percent. China, which has sustained strong growth throughout all of the periods examined, ranked fourth at 54 percent. Myanmar, now emerging from decades of dictatorship, was the fifth fastest growing economy, at 49 percent (Figure 1).
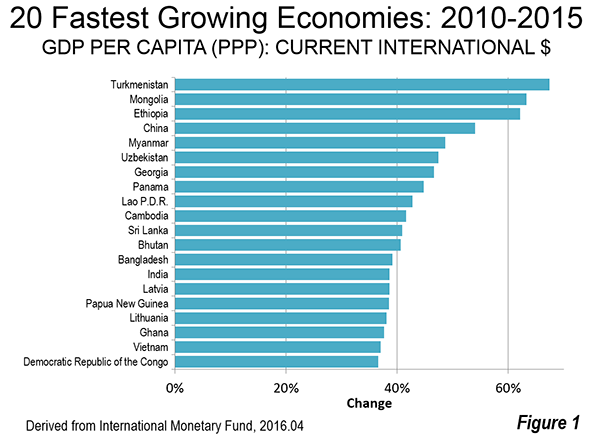
The top 20 included two of the world’s poorest economies, third ranked Ethiopia, with a GDP per capita of $1,800 and the Democratic Republic of the Congo (DRC), which ranked 19th, with a GDP per capita of $800 (both figures are after the 2010-2015 increase). The improvement in the DRC is thus very encouraging, but it is from a severely impoverished base.
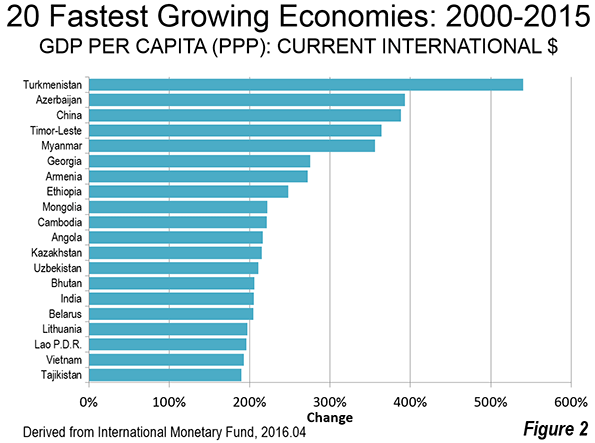
2000-2015: Perhaps surprisingly, nine of the 20 fastest growing economies over the interim period (2010-2015) are former Soviet republics. Turkmenistan was, as between 2010 and 2015, the fastest growing, at 540 percent. Turkmenistan was joined by fellow former Soviet Azerbaijan , which grew 393 percent. Other former Soviet republics in the top 20 included Georgia, Armenia, Kazakhstan, Uzbekistan, Belarus, Lithuania and Tajikistan. However, the largest former Soviet republic of all, the Russian Federation, was not among the fastest growing but placed a respectable 45th .
China ranked third in economic growth, only slightly below Azerbaijian.at 388 percent. Timor-Leste, recovering from its intense ethnic conflict, ranked fourth. Myanmar ranked fifth.
1980-2015: Over the longer period (1980-2015), Equatorial Guinea grew the fastest, at more than 8,000 percent, driven by its rich oil resources. China ranked second, at 4,500 percent. This huge increase was from a second worst in the world GDP per capita, which was a mere $300 in 1980. Small Bhutan ranked third, at 1,627 percent, followed by the Republic of Korea (South Korea), which grew 1,572 percent, to become one of the world’s strongest economies. Vietnam ranked fifth, growing 1,283 percent (Figure 3).
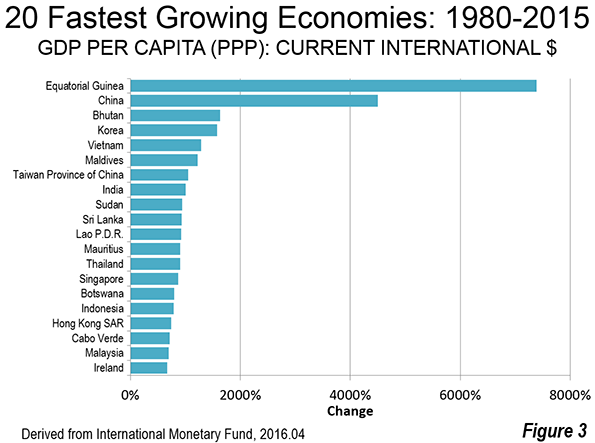
Three of the world’s richest economies, with GDP’s per capita above $50,000, were also among its fastest growing between 1980 and 2015. These included Singapore (14th), Hong Kong (17th) and Ireland (20th).
Slowest Growing Economies
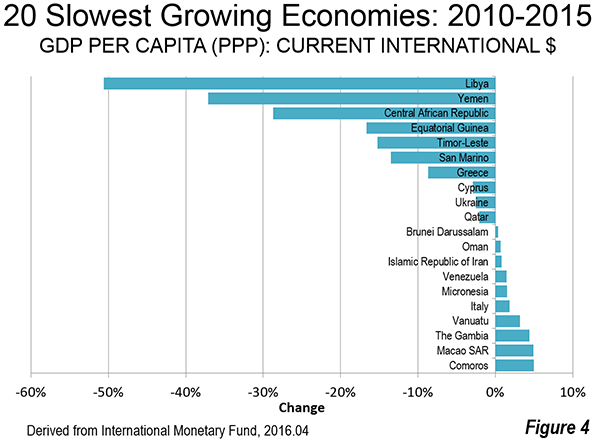
2010-2015: The slowest growing economies in the last five years have suffered serious civil disorder. Troubled Libya experienced a more than halving of its GDP per capita between 2010 and 2015. In 2010, Libya had a GDP per capita of $29,600, more than long-time European Union (EU-15) members Greece ($29,000) and Portugal ($26,500). By 2015, Libya had dropped to $14,600, less than Brazil ($15,600) and the Dominican Republic ($15,000).
Similarly unstable Yemen experienced a loss of 37 percent, from $4,200 to $2,700.
The Civil war ravaged Central African Republic lost 29 percent in GDP per capita. This is made worse by the fact that the Central African Republic ranked 185th in GDP per capita in 2010 out of the 189 geographies for which there is data. The 2015 data shows the Central African Republic to rank dead last in GDP per capita, 190th out of 190.
Oil producing Equatorial Guinea experienced a loss of 17 percent in its GDP per capita, which is particularly significant, since Equatorial Guinea had the largest gain of any economy between 1980 and 2015.
Three current European Union members were among the slowest growing economies. Greece had the 7th largest loss (-8.8 percent), while Cypress had the 8th largest loss (2.9 percent). Italy was the 16th slowest growing economy, gaining 1.8 percent (Figure 4).
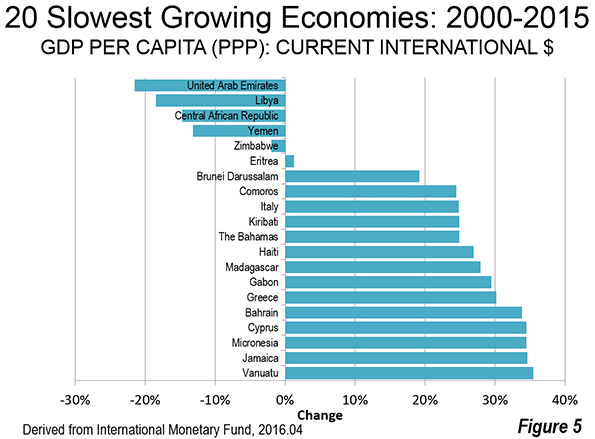
2000-2015: The largest loss in GDP per capita between 2000 and 2015 was experienced by the oil producing United Arab Emirates. The next three greatest losses were in Libya, the Central African Republic and Yemen, which also sustained the largest losses between 2010 and 2015. The same three European Union members as in 2010-2015 made the 2000-2015 slowest growth list, Italy, Greece and Cypress (Figure 5).
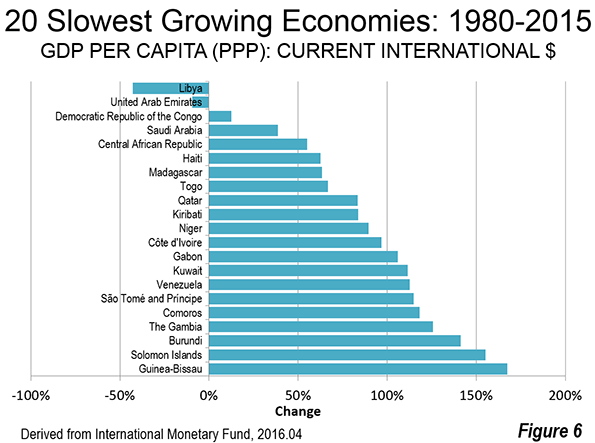
1980-2015: Libya and the United Arab Emirates were the only geographies to post GDP per capita losses over the past 35 years. Miniscule growth was experienced in the third slowest growing Democratic Republic of the Congo, though as indicated above, the DRC managed to make the top 20 in growth between 2010 and 2015.
The Future
While there is much to celebrate about economic growth over the last 35 years and even in the more recent periods, far too much of the world lives in poverty and middle-income standards of living are declining, especially in the high-income world. These factors were the subject of discussions at the 2014 Brisbane G20 conference, when world leaders adopted a communique stressing a commitment to improving standards of living and eradicating poverty.
Yet, a year and half later, International Monetary Fund Managing Director Christine Lagarde expressed a cautionary note in introducing the organization’s latest World Economic Outlook. The IMF indicated that Director Legarde warned that the recovery remains too slow, too fragile, with the risk that persistent low growth can have damaging effects on the social and political fabric of many countries. It is to be hoped that future reports will show large numbers of people exiting poverty, and a resumption in the rise of middle-income living standards. If these run in tandem, the world economy will be in the best shape in history.
Wendell Cox is principal of Demographia, an international pubilc policy and demographics firm. He is a Senior Fellow of the Center for Opportunity Urbanism (US), Senior Fellow for Housing Affordability and Municipal Policy for the Frontier Centre for Public Policy (Canada), and a member of the Board of Advisors of the Center for Demographics and Policy at Chapman University (California). He is co-author of the "Demographia International Housing Affordability Survey" and author of "Demographia World Urban Areas" and "War on the Dream: How Anti-Sprawl Policy Threatens the Quality of Life." He was appointed to three terms on the Los Angeles County Transportation Commission, where he served with the leading city and county leadership as the only non-elected member. He served as a visiting professor at the Conservatoire National des Arts et Metiers, a national university in Paris.
Photograph: Addis Abeba, capital of Ethiopia (3rd fastest growing economy 2010-2015)


