
The new data on net domestic migration between major metropolitan areas (more than 1,000,000 residents) over the last three years (July 2020 to July 2023) shows a strong movement of people away from higher urban densities to lower urban densities. This is consistent with the strong national data showing movement away from higher urban density among the nation’s more than 3,100 counties (and county equivalent jurisdictions), as reported in our recent Americans Accelerate Move Away from Density. This article applies the same urban density weighted analysis of net domestic migration within the major metropolitan areas.
Background
Each year, the Census Bureau estimates net domestic migration (migrating in minus migrating out) at the county level. There is no “in” or “out” data, only net. Counties are the lowest geography at which net domestic migration is estimated. Thus, there is no sub-county data, such as cities (except where cities and counties have the same geographic boundaries, such as Baltimore, Washington, Philadelphia, St. Louis and, of course New York, which consists of five complete counties). Further, the Census Bureau net domestic migration include only population counts, but no other characteristics, such as income, age or race.
Metropolitan Areas: US metropolitan areas are composed of entire counties and are labor (and housing) markets. They are defined periodically by the Office of Management and Budget (OMB), based on commuting data. Metropolitan areas are organized around urban areas, which include continuous development from the urban core to the urban fringe (where rural land begins). Before 2000, metropolitan areas were organized around “central cities,” such as the city of Miami, the city of Chicago, etc. But as job creation moved strongly to the suburbs, the larger urban area was substituted in the commuting analysis. Among the 56 major metropolitan areas, four have only one county (San Diego, Las Vegas, Tucson and Honolulu), while Atlanta has the most counties, at 29.
Many metropolitan areas stretch into more than one state. For example, the Washington metropolitan area is in not only the District of Columbia, but also in Virginia, Maryland and West Virginia. The Minneapolis-St Paul metropolitan area is not only in Minnesota, but also Wisconsin. Metropolitan areas have both urban and rural land, with the vast majority being rural. This is in contrast to urban areas, which have only urban land. Surprisingly, urban areas and metropolitan areas are too frequently confused in academic literature.
General Major Metro Area Trends
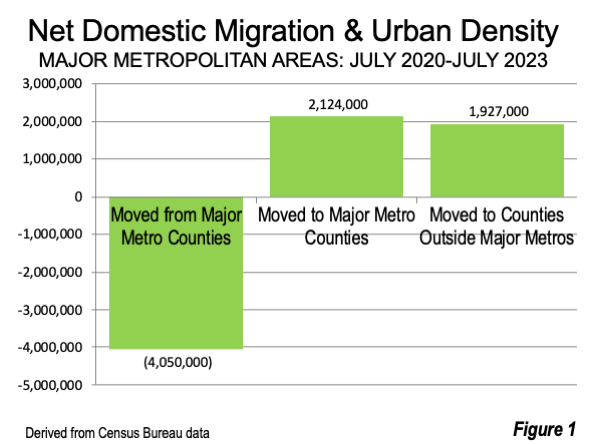
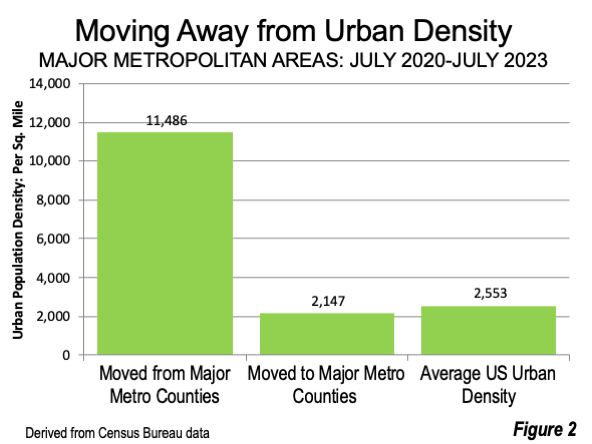
Major metropolitan counties lost 4,050,000 net domestic migrants between 2020 and 2023, while other major metropolitan area counties gained 2,134,000. The balance of 1,927,000 moved to other areas, including smaller metropolitan as well as non-metropolitan counties (Figure 1) that in the past were mostly losing domestic migrants. But the significance of a 4,050,000 movement from higher urban density to lower urban densities counties can be described as an 8,100,000 gap. By 2023, the higher urban density counties from which people moved (11,486 per square mile) had 8,100,000 fewer people than the lower density counties to which people moved (2,147 per square mile). This is lower than the national average urban area density of 2,553 per square mile (Figure 2). Overall, major metropolitan area counties attracting domestic migrants had urban densities 81.3% lower than counties losing net domestic migrants.
Net Domestic Migration Weighted by Urban Density: Metro Data
Net domestic migration has been overwhelmingly away from more intense urbanization — that is from counties with higher urban densities to counties with lower urban densities. Counties with higher urban population densities are often in or near the urban cores of the largest metropolitan areas.
The relationship between net domestic migration and county urban density in major metropolitan areas is illustrated by a population weighted analysis. View/download the table data.
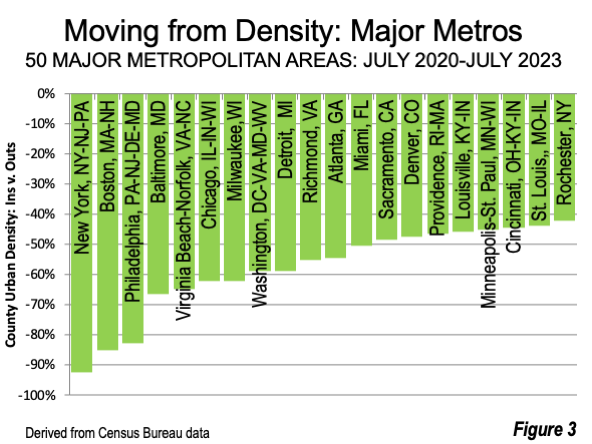
The smallest difference between the urban densities of counties to which people are moving and those they are moving from is 4.1% in Riverside-San Bernardino (3,500 to 3,350). The largest difference is in New York, where the “moving in” urban densities are 92.6% lower than those of the counties from which people are moving (31,400 to 2,300). In Boston and Philadelphia, the counties into which people are moving have urban densities 80% below the counties from which people are moving. In Baltimore, Virginia Beach-Norfolk, Chicago, and Milwaukee, the counties to which people are moving have urban densities at least 80% below those from which people are moving. In Detroit, Richmond, Atlanta and Miami the difference is at least 50% (Figure 3).
Among the 40 major metropolitan areas that had counties with both gains and losses, people moved into counties with lower urban densities and people moving out left counties with higher urban densities in all cases.
This is an overwhelming trend that is the opposite of the densification that the urban planning orthodoxy seeks.
At Least Two Centuries of Suburbanization
The domestic migration in the last three years represents an acceleration of the suburban growth that has been dominant in recent decades. Indeed, people have been moving out of dense urban cores for more than two centuries. Columbia University historian Kenneth T. Jackson reported, for example (in Crabgrass Frontier: The Suburbanization of the United States), that central Philadelphia had begun losing population between the 1800 and 1810 censuses. Suburbanization in the United States goes back at least this far.
Note: Major metropolitan area Hartford, CT is not included in this analysis due to a state post-2020 Census county reconfiguration.
Wendell Cox is principal of Demographia, an international public policy firm located in the St. Louis metropolitan area. He is a Senior Fellow with the Frontier Centre for Public Policy in Winnipeg and a member of the Advisory Board of the Center for Demographics and Policy at Chapman University in Orange, California. He has served as a visiting professor at the Conservatoire National des Arts et Metiers in Paris. His principal interests are economics, poverty alleviation, demographics, urban policy and transport. He is co-author of the annual Demographia International Housing Affordability Survey and author of Demographia World Urban Areas.
Mayor Tom Bradley appointed him to three terms on the Los Angeles County Transportation Commission (1977-1985) and Speaker of the House Newt Gingrich appointed him to the Amtrak Reform Council, to complete the unexpired term of New Jersey Governor Christine Todd Whitman (1999-2002). He is author of War on the Dream: How Anti-Sprawl Policy Threatens the Quality of Life and Toward More Prosperous Cities: A Framing Essay on Urban Areas, Transport, Planning and the Dimensions of Sustainability.
Photo: Suburban development in the city of Los Angeles, via Wikimedia under CC BY 3.0 license.


