
This article describes work access in the Los Angeles combined statistical area (Los Angeles, Orange, Riverside, San Bernardino and Ventura counties) from 1980 to 2022, using US Census Bureau data. The combined statistical area (CSA) is comprised by the Los Angeles, Riverside-San Bernardino and Oxnard metropolitan areas. (view Table 1; pdf opens in new tab/window).
Over the period, there has been substantial employment growth, from a daily 5,184,000 workers in 1980 to 8,850,000 in 2022 (an increase of 71% in 42 years). The 2022 figure is down from the pre-pandemic (2019) total of 8,937,000. Both Los Angeles and Orange counties, the two most populous, had lower employment levels in 2022 than in 2019, with Los Angeles down 170,000 and Orange down 26,000. The other three counties had gains, including Riverside up 67,000, San Bernardino up 28,000 and Ventura up 1,000.
This job growth as we can see was overwhelmingly outside the urban core and is a acceleration of existing trends. Driving alone, working from home and car pools now accounted for 93% of work access in 2022 (Figure 1).

Driving Alone: Even in Los Angeles, driving alone is dropping, in response to the work at home revolution. Between 1980 and 2019, driving alone increased as a share of work access in all five counties, with an overall rise from 70.2% to 76.0%. This is despite opening an expansive urban rail system in Los Angeles County and a commuter rail system serving all five counties. In Los Angeles County, driving alone rose from 70.2% to 73.9% (view Table 2; pdf opens in new tab/window).
But the remote work revolution significantly reduced driving alone from 76.0% in 2019 to 67.4% in 2022, The total solo drivers were 5.929 million in 2022, below the 2015 figure of 6.093 million. In Los Angeles County, driving alone in 2022 fell below the 2010 level.
Working from Home: Working from home had an overall work from home market share of 15.7% in 2022, compared to 6.2% in 2019, an increase of 153%. The leaders in working from home were Orange County, both with a 17.8% market share and Los Angeles County with a 17% share. Ventura County was close behind, at 15.4%, while Riverside had an 11.7% share and San Bernardino County had an 11% share.
Overall, working from home has risen more to more than 10 times its 1980s share of 1.5%.
Car Pool: Car Pools suffered losses in the early years, but have attracted similar commuting numbers since 2010, having dropped from 900,000 to 898,000 in 2022.
Transit: Transit commuting fell to a level below that of 1980. In 2022, transit accounted for 218,000 daily work trips, well below the 264,000 in 1980. The peak year among those included in this analysis was 2010, when transit commuting rose to 381,000. Even before the pandemic, transit commuting was declining, and the 2019 market share was the lowest of any analyzed year. Transit commuting fell to 339,000 in 2019, and then fell about another one-third to 2022.
Recovery from the Pandemic: Transit’s pre-Covid 2019 market share was 3.8% overall and 5.7% in Los Angeles County. This compares to 5.0% for the CSA and 7.2% for Los Angeles County in 2010 (Figure 2).
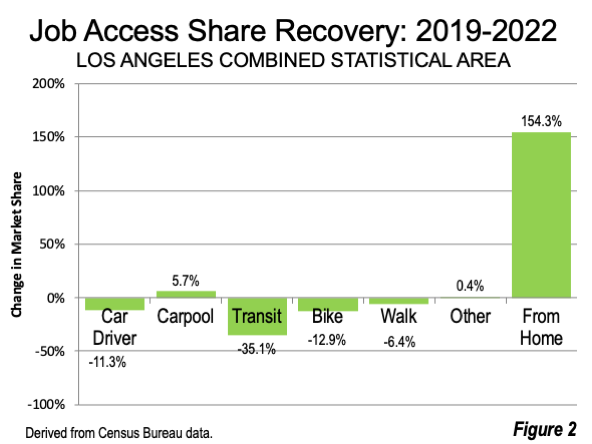
Transit has done the least well in recovering from its pandemic losses, with 2022 commuting 35.8% below the 2019 figure. Driving alone has recovered to a loss of 11.3% of its 2019 commuting share.Meanwhile, among the work access modes that involve travel, car pools have done the best, rising to 5.7% above the 2019 level.Bicycle commuting has fallen 12.0% and walking has fallen by 6.4%.
There have been many significant dates since 1980. For example:
- 1980: Los Angeles County Transportation Commission adopts Proposition A, which is approved by the voters in the November election. Proposition A provided funding for a three-year flat fare, a program to support local government transit and funding for a proposed urban rail (light rail and subway) system.
- 1985: Record ridership year for the largest Los Angeles transit operator (SCRTD now Metro) at 497 million.
- 1990: First modern urban rail service begins on Line A (formerly the Blue Line), between downtown (7th and Flower) and Long Beach. The data shown on the tables is from before the start of service on this line. The rail system now serves more than 120 one-way route miles and significant expansions are being built and planned.
- 1992: Metrolink commuter rail system begins operation, with service to all five CSA counties as well as a station in San Diego County (Oceanside). Metrolink now serves more than 550 one-way route miles.
- 1993: Merger between the Los Angeles County Transportation Commission (transportation policy organization) and the Southern California Rapid Transit District (transit operator), forming the Los Angeles County Metropolitan Transportation Authority (MTA).
- 2024: Largest Los Angeles transit operator (Metro) carried 300 million riders (fiscal year ended June 30), 40% below the peak year (1985).
Overall, the biggest change has to be the extensive rail systems, both urban and commuter, that have been opened. Having been on the Los Angeles County Transportation Commission when the planning for the system began, I have been amazed that transit with rail served considerably fewer riders than transit before rail, when there were only buses. I, and likely most other members, expected material increases in ridership.
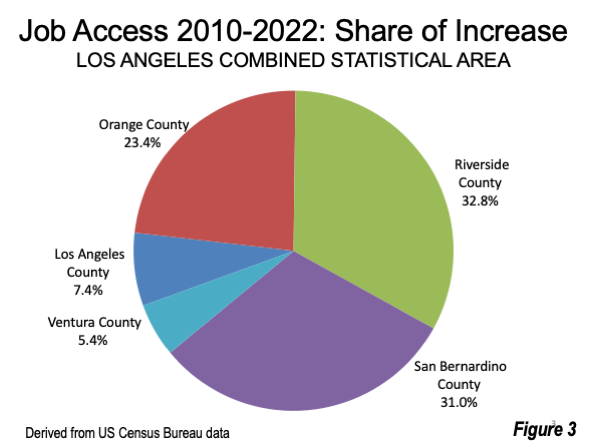
There is another large change, which is the shift of workers to residences in more suburban and exurban areas. This is particularly evident between 2010 and 2022, when only 7% of new (incremental) work access demand came from Los Angeles County, despite its having over one-half the population of the CSA. The greatest demand increases were in Riverside County (33% of the total) and San Bernardino County (31%), followed by Orange County (23%). The smallest share of the demand increase was in Ventura County (5%). (Figure 3) This is typical of the continuing spread of development to more distant suburbs and exurbs. None of this bodes well for the future of transit.
Also see:
The Cost of Opportunity Cost Blindness to the Riders and Taxpayers
Transit in Los Angeles: Lost Opportunities
The Work at Home Revolution: Data and Policy Implications
Wendell Cox is principal of Demographia, an international public policy firm located in the St. Louis metropolitan area. He is a Senior Fellow with the Frontier Centre for Public Policy in Winnipeg and a member of the Advisory Board of the Center for Demographics and Policy at Chapman University in Orange, California. He has served as a visiting professor at the Conservatoire National des Arts et Metiers in Paris. His principal interests are economics, poverty alleviation, demographics, urban policy and transport. He is co-author of the annual Demographia International Housing Affordability Survey and author of Demographia World Urban Areas.
Mayor Tom Bradley appointed him to three terms on the Los Angeles County Transportation Commission (1977-1985) and Speaker of the House Newt Gingrich appointed him to the Amtrak Reform Council, to complete the unexpired term of New Jersey Governor Christine Todd Whitman (1999-2002). He is author of War on the Dream: How Anti-Sprawl Policy Threatens the Quality of Life and Toward More Prosperous Cities: A Framing Essay on Urban Areas, Transport, Planning and the Dimensions of Sustainability.
Photo: Interstate 110 (Harbor Freeway)/Interstate 105 (Century Freeway) in Los Angeles County (which includes general purpose lanes, car pool lanes, toll lanes, an exclusive busway and light rail Line C, via Wikimedia, by Remi Jouan, under CC 3.0 License.


