Recently, the high density of Los Angeles became an issue in a proposed city of Vancouver high rise development project (six buildings of from 12 to 40 stories). A July 4 Vancouver Sun article, by Susan Lazarak (“Vancouver proposes huge housing development at north end of Granville Bridge”) cited University of British Columbia regional planning professor Michael Hooper to the effect that concentrating tall towers but allowing lower density elsewhere doesn’t necessarily translate into a high overall density. In particular, he noted that Los Angeles has higher overall density than New York City because L.A. has “vast swaths of middle-density buildings” throughout the city.
Professor Hooper makes a valid and often misunderstood point on tall towers. Indeed, the Corbusian towers, which have been built in many cities, and famously rejected in Paris, are not required to achieve higher densities.
But first, some background…
This article clarifies often misunderstood urban density issues.
First of all, the city (municipality) of Los Angeles is not denser than the city of New York.
However, the Los Angeles urban area is considerably denser than the New York urban area. The urban area is the area of continuous development, and excludes all rural land (by definition, all land that is not urban is rural, according to both Statistics Canada and the US Census Bureau).
For example, the Vancouver urban area (the Statistics Canada term for urban area is “population centre”), stretches from Horseshoe Bay to Langley and Richmond to Maple Ridge and Port Coquitlam (Figure 1, Statistics Canada map of the Vancouver population centre).
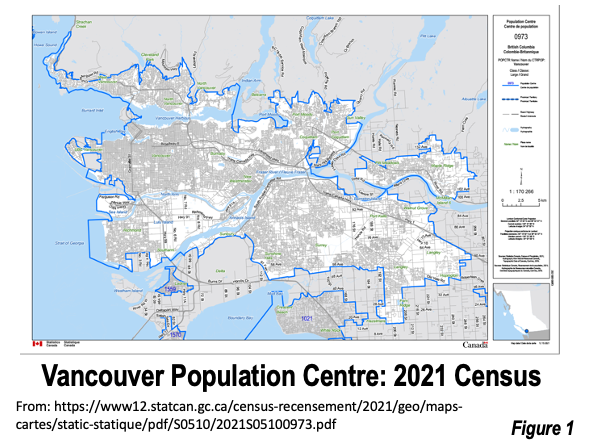
Urban areas/population centres are defined by Statistics Canada and the US Census Bureau based on data from small census enumeration zones, without regard to municipal limits or even provincial or state boundaries (such as Ottawa-Gatineau, ON-QC, or Philadelphia, PA-NJ-DE-MD).
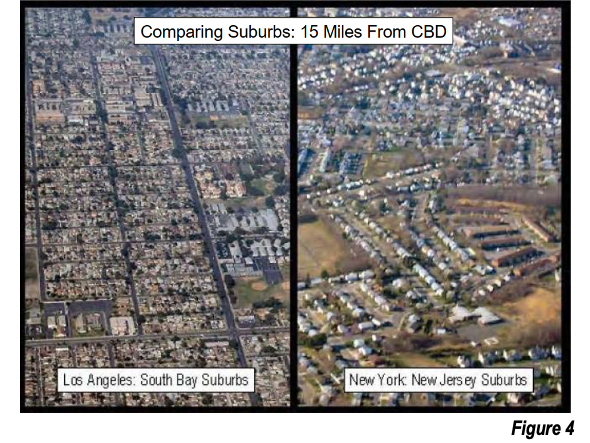
Moreover, the suburbs of Los Angeles (the part of the urban area outside the city), are about twice as dense as those of New York. This more than compensates for the higher municipal density in New York.
Urban areas are not metropolitan areas (census metropolitan areas). Population centres/urban areas are the highest geographical level at which urban density can be measured, because any higher level is at least partially rural. Metropolitan area densities are combined urban and rural densities.
In the United States, 81% of the land in metropolitan areas with more than 1,000,000 residents was rural in 2010 (see: Rural Character in America’s Metropolitan Areas). The 2021 census indicates that the Vancouver population centre comprises only 32% of the land in the Vancouver census metropolitan area.
Back to Los Angeles and New York…
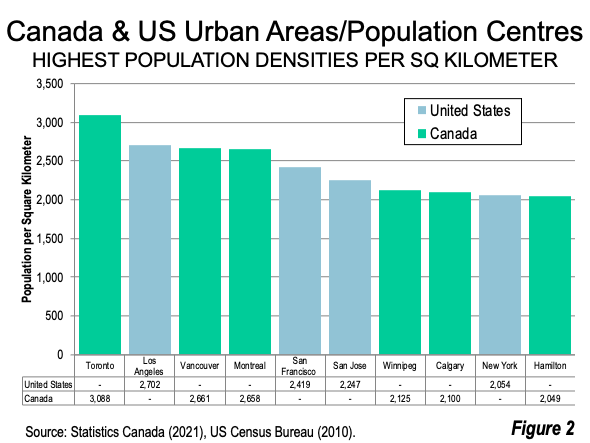
The United States Census Bureau delineates the land area of urban areas in its census. The current release is based on the 2010 census. The Los Angeles urban area had a population density of 2,702 per square kilometer, more than 30% higher than New York’s 2,054. The Toronto population centre had a density of 3,088 according to the 2021 census, nearly 15% higher than Los Angeles (Figure 2).
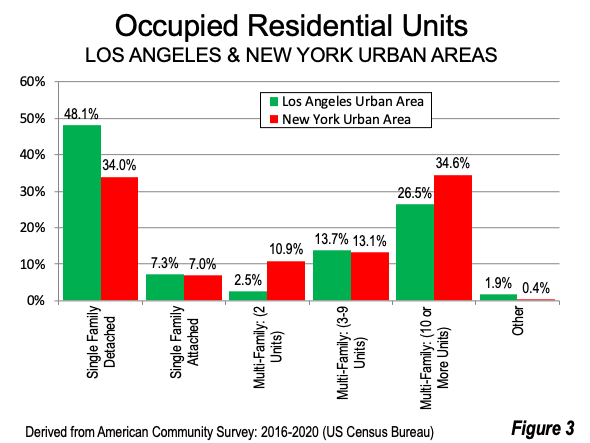
The latest data from the American Community Survey (see Note 1) shows that the largest difference in housing types between the Los Angeles and New York urban areas is among single-family detached houses (Figure 3, see Note 2). In Los Angeles, 40% more of the housing stock is detached than in New York (48.4% compared to 34.0%).
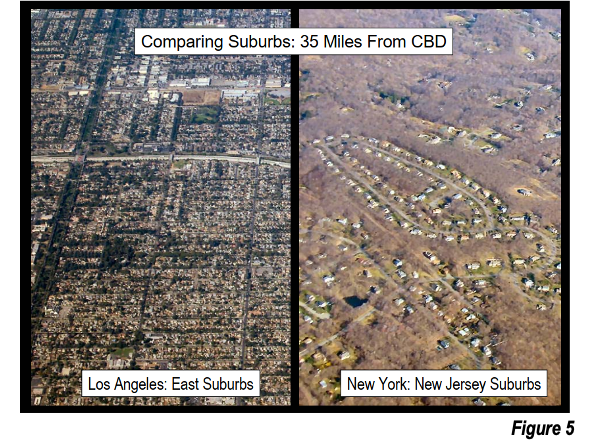
The higher density, detached housing suburbs of Los Angeles are contrasted photographically with those of New York, at distances of 24 kilometers/15 miles and 56 kilometers/35 miles from the urban cores (Figures 4 and 5).
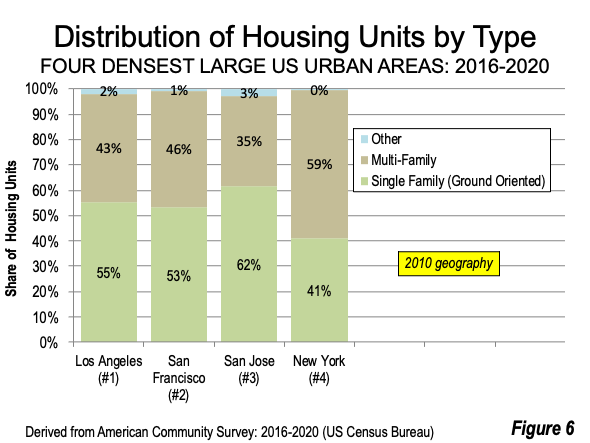
Even the San Francisco (2,249) and San Jose (2,267) urban areas have higher urban densities than New York. Like Los Angeles, San Francisco and San Jose have a larger share of single-family housing and a lower share of multi-family housing than New York — the opposite of what would be expected. As with Los Angeles, the higher densities of the San Francisco and San Jose urban areas compared to New York are driven by their detached housing on smaller lots (Figure 6).
Ironically, Los Angeles has long been considered the epitome of urban sprawl — probably more than any other urban area. If this perception were true, then every large population centre/urban area in Canada and the United States would be denser than Los Angeles. The reality? Only Toronto is denser (Figure 2).
Note 1: The later American Community Survey data for urban areas is based on the land area as defined by the Census Bureau in 2010.
Note 2: The factors contributing to urban density in this article relate only to residential densities. There is no readily available source for the extent of land use by non-residential functions, such as commercial, industrial and public facilities.
Wendell Cox is principal of Demographia, an international public policy firm located in the St. Louis metropolitan area. He is a founding senior fellow at the Urban Reform Institute, Houston, a Senior Fellow with the Frontier Centre for Public Policy in Winnipeg and a member of the Advisory Board of the Center for Demographics and Policy at Chapman University in Orange, California. He has served as a visiting professor at the Conservatoire National des Arts et Metiers in Paris. His principal interests are economics, poverty alleviation, demographics, urban policy and transport. He is co-author of the annual Demographia International Housing Affordability Survey and author of Demographia World Urban Areas.
Mayor Tom Bradley appointed him to three terms on the Los Angeles County Transportation Commission (1977-1985) and Speaker of the House Newt Gingrich appointed him to the Amtrak Reform Council, to complete the unexpired term of New Jersey Governor Christine Todd Whitman (1999-2002). He is author of War on the Dream: How Anti-Sprawl Policy Threatens the Quality of Life and Toward More Prosperous Cities: A Framing Essay on Urban Areas, Transport, Planning and the Dimensions of Sustainability.


