NewGeography.com blogs
Metropolitan America continues to expand. The new Office of Management and Budget metropolitan area definitions, based upon the 2010 census indicate that the counties composing the 52 metropolitan areas with more than 1 million population increased by 1.65 million from the previous definition. This includes more than 1.4 million new residents in the previous 51 major metropolitan areas and more than 200,000 in Grand Rapids, which has become the nation's 52nd metropolitan area with more than 1 million population.
The fastest growers due to the addition of counties were New York, Charlotte, Grand Rapids, and Indianapolis. New York had a 670,000 increase in its metropolitan population, resulting from the addition of Dutchess and Orange counties. New counties also increased the population of the Charlotte metropolitan area by 459,000, the Grand Rapids metropolitan area by 215,000 and Indianapolis by 132,000. The largest percentage gains were in Grand Rapids (28%) and Charlotte (26%).
Ten metropolitan areas had population increases under 100,000 from expansion of the metropolitan area definitions.
For the most part, the major metropolitan area county components were unchanged, with 31 having the same boundaries as under the previous definition. Six metropolitan areas were reduced in geographic size.
The changes in population for 2000 based upon the new metropolitan area definitions are indicated in the table. The components of metropolitan areas are determined by commuting patterns to urban areas (not to the historical core municipalities).
| Effect of New Metropolitan Area Geographic Definition on Population: 2010 |
| Population Change Rank |
Metropolitan Area |
Old Definition |
New Definition (2013) |
Change |
% Change |
| 12 |
Atlanta, GA |
5,268,860 |
5,286,728 |
17,868 |
0.3% |
| 15 |
Austin, TX |
1,716,289 |
1,716,289 |
0 |
0.0% |
| 15 |
Baltimore, MD |
2,710,489 |
2,710,489 |
0 |
0.0% |
| 15 |
Birmingham, AL |
1,128,047 |
1,128,047 |
0 |
0.0% |
| 15 |
Boston, MA-NH |
4,552,402 |
4,552,402 |
0 |
0.0% |
| 15 |
Buffalo, NY |
1,135,509 |
1,135,509 |
0 |
0.0% |
| 2 |
Charlotte, NC-SC |
1,758,038 |
2,217,012 |
458,974 |
26.1% |
| 15 |
Chicago, IL-IN-WI |
9,461,105 |
9,461,105 |
0 |
0.0% |
| 46 |
Cincinnati, OH-KY-IN |
2,130,151 |
2,114,580 |
(15,571) |
-0.7% |
| 15 |
Cleveland, OH |
2,077,240 |
2,077,240 |
0 |
0.0% |
| 7 |
Columbus, OH |
1,836,536 |
1,901,974 |
65,438 |
3.6% |
| 8 |
Dallas-Fort Worth, TX |
6,371,773 |
6,426,214 |
54,441 |
0.9% |
| 15 |
Denver, CO |
2,543,482 |
2,543,482 |
0 |
0.0% |
| 15 |
Detroit, MI |
4,296,250 |
4,296,250 |
0 |
0.0% |
| 3 |
Grand Rapids, MI |
774,160 |
988,938 |
214,778 |
27.7% |
| 15 |
Hartford, CT |
1,212,381 |
1,212,381 |
0 |
0.0% |
| 49 |
Houston, TX |
5,946,800 |
5,920,416 |
(26,384) |
-0.4% |
| 4 |
Indianapolis. IN |
1,756,241 |
1,887,877 |
131,636 |
7.5% |
| 15 |
Jacksonville, FL |
1,345,596 |
1,345,596 |
0 |
0.0% |
| 48 |
Kansas City, MO-KS |
2,035,334 |
2,009,342 |
(25,992) |
-1.3% |
| 15 |
Las Vegas, NV |
1,951,269 |
1,951,269 |
0 |
0.0% |
| 15 |
Los Angeles, CA |
12,828,837 |
12,828,837 |
0 |
0.0% |
| 51 |
Louisville, KY-IN |
1,283,566 |
1,235,708 |
(47,858) |
-3.7% |
| 13 |
Memphis, TN-MS-AR |
1,316,100 |
1,324,829 |
8,729 |
0.7% |
| 15 |
Miami, FL |
5,564,635 |
5,564,635 |
0 |
0.0% |
| 15 |
Milwaukee,WI |
1,555,908 |
1,555,908 |
0 |
0.0% |
| 6 |
Minneapolis-St. Paul, MN-WI |
3,279,833 |
3,348,859 |
69,026 |
2.1% |
| 5 |
Nashville, TN |
1,589,934 |
1,670,890 |
80,956 |
5.1% |
| 11 |
New Orleans. LA |
1,167,764 |
1,189,866 |
22,102 |
1.9% |
| 1 |
New York, NY-NJ-PA |
18,897,109 |
19,567,410 |
670,301 |
3.5% |
| 15 |
Oklahoma City, OK |
1,252,987 |
1,252,987 |
0 |
0.0% |
| 15 |
Orlando, FL |
2,134,411 |
2,134,411 |
0 |
0.0% |
| 15 |
Philadelphia, PA-NJ-DE-MD |
5,965,343 |
5,965,343 |
0 |
0.0% |
| 15 |
Phoenix, AZ |
4,192,887 |
4,192,887 |
0 |
0.0% |
| 15 |
Pittsburgh, PA |
2,356,285 |
2,356,285 |
0 |
0.0% |
| 15 |
Portland, OR-WA |
2,226,009 |
2,226,009 |
0 |
0.0% |
| 15 |
Providence, RI-MA |
1,600,852 |
1,600,852 |
0 |
0.0% |
| 15 |
Raleigh, NC |
1,130,490 |
1,130,490 |
0 |
0.0% |
| 52 |
Richmond, VA |
1,258,251 |
1,208,101 |
(50,150) |
-4.0% |
| 15 |
Riverside-San Bernardino, CA |
4,224,851 |
4,224,851 |
0 |
0.0% |
| 10 |
Rochester, NY |
1,054,323 |
1,079,671 |
25,348 |
2.4% |
| 15 |
Sacramento, CA |
2,149,127 |
2,149,127 |
0 |
0.0% |
| 47 |
St. Louis,, MO-IL |
2,812,896 |
2,787,701 |
(25,195) |
-0.9% |
| 50 |
Salt Lake City, UT |
1,124,197 |
1,087,873 |
(36,324) |
-3.2% |
| 15 |
San Antonio, TX |
2,142,508 |
2,142,508 |
0 |
0.0% |
| 15 |
San Diego, CA |
3,095,313 |
3,095,313 |
0 |
0.0% |
| 15 |
San Francisco-Oakland, CA |
4,335,391 |
4,335,391 |
0 |
0.0% |
| 15 |
San Jose, CA |
1,836,911 |
1,836,911 |
0 |
0.0% |
| 15 |
Seattle, WA |
3,439,809 |
3,439,809 |
0 |
0.0% |
| 15 |
Tampa-St. Petersburg, FL |
2,783,243 |
2,783,243 |
0 |
0.0% |
| 14 |
Virginia Beach-Norfolk, VA-NC |
1,671,683 |
1,676,822 |
5,139 |
0.3% |
| 9 |
Washington, DC-VA-MD-WV |
5,582,170 |
5,636,232 |
54,062 |
1.0% |
|
|
|
|
|
|
|
Total |
167,861,575 |
169,512,899 |
1,651,324 |
1.0% |
The New South Wales government has proposed a new Metropolitan Strategy for the Sydney area which would significantly weaken the urban containment policy (also called urban consolidation, smart growth, livability, growth management, densification, etc.) that has driven if house prices to among the highest in the affluent New World (Australia, Canada, New Zealand and the United States) relative to household incomes.
According to the Australian Financial Review, the state's Liberal-National government plans to allow the building of more than 170,000 new homes, with the vast majority being on greenfield sites, largely beyond the current urban footprint. Premier Barry O'Farrell and his party had promised in their electoral campaign in 2011 to liberalize land-use regulation and to moderate the previous Labor government's quota that required 70% of new houses to be built within the current urban footprint and 30% on greenfield sites. In fact, however, under the Labor government's administration, new house building had been produced at a well below demand level.
Among the major New World metropolitan areas rated in annual Demographia International Housing Affordability Surveys, Sydney has been the most unaffordable, along with Vancouver, in recent years. Sydney and Vancouver have had among the most stringent urban containment policies in the New World, and the resulting unaffordable house prices under such circumstances are consistent with economic principle.
Premier O'Farrell told the Sydney Morning Herald that the government wanted to "make home ownership a reality again." He continued, "The more blocks of land (lots) we can release, the greater downward pressure we can put on housing because it's been so high for so long." In a press release issued by his office, the Premier recalled that “Before the election, I said I wanted to ensure owning a home wasn’t a fading dream for young families" and noted that the massive housing package "will go a long way to delivering on that commitment."
In the longer run (by 2031), the government intends to provide for a total of 545,000 new homes, while abandoning the practice of allocating locations based upon planning theory. Planning and Infrastructure Minister Bradley Hazzard told the Sydney Morning Herald that the government intended to “look further afield” than the presently planned greenfield suburban growth centers. He continued: "We're trying to [be] less constrictive and restrictive and what we're saying is the marketplace should have far more of a say in what the mix of housing is and where it should be,'' adding that ''it doesn't matter'' what percentage was delivered in greenfield and established suburbs. He concluded: ''No one should be preoccupied by particular prescriptive formulas.''
The government also indicated its intention to encourage one half of employment growth over the next 20 years to be in Western Sydney. Western Sydney is virtually across the urban area from the central business district. This dispersion of employment, along with roadway improvements in the area, is likely to improve the metropolitan balance between jobs and housing.
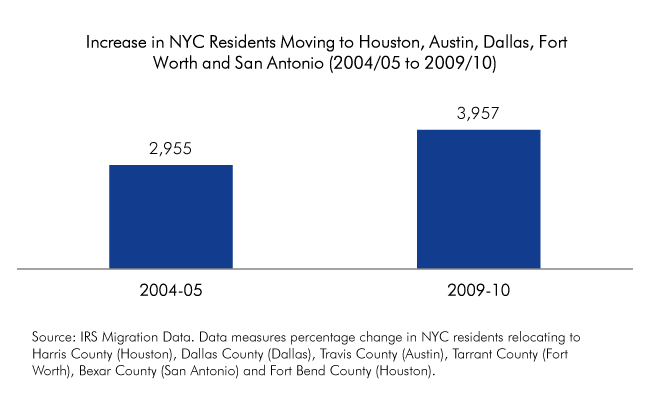
The plan for greater job dispersion would, if successful, bring Sydney more into line with urban best practices, which are exhibited by the location of most new jobs in edge cities, as well as throughout the entire urban area. Sydney has among the longest work trip travel times in the New World. The one-way work trip travel time is newly reported in the Metropolitan Strategy to have reached 35 minutes. Work trip travel times are worse only in Melbourne, at 36 minutes. By comparison, Dallas-Fort Worth, with a larger population, a much lower urban area density and a mere fraction of the Melbourne or Sydney transit work trip market share has a far shorter one-way work trip travel time (26 minutes).
The Sydney developments are the latest in a trend toward liberalizing urban land use in four nations.
In October, the New Zealand government announced plans to liberalize land-use amid growing concern about the extent to which that nation's urban containment policies have destroyed housing affordability. In the introduction to the 9th Annual Demographia International Housing Affordability Survey, Deputy Premier Bill English said:
Land has been made artificially scarce by regulation that locks up land for development. This regulation has made land supply unresponsive to demand. When demand shocks occur, as they did in the mid-2000s in New Zealand and around the world, much of that shock translates to higher prices rather than more houses.
Recent polling has shown support, by an almost 2 to 1 margin for government action to improve housing affordability, with even higher stronger support in the 18 to 34 age group, where the margin was more than 3 to 1.
The United Kingdom Cameron government is also embarked on a program to liberalize that nation's restrictive land use policies, which former Bank of England Monetary Policy Committee member Kate Barker found to be the cause of severe housing unaffordability in a report commissioned by the Blair Labour government. Planning Minister Nick Boles has characterized the unaffordability of housing as "the biggest social justice problem we have."
In 2011, Florida repealed its statewide smart growth mandate and closed the administrative bureaucracy that had overseen the program. Before that, the government of the Australian state of Victoria substantially expanded the urban growth boundary of the Melbourne urban area.
It seems like not a week goes by without fresh warnings about the nation’s”crumbling infrastructure" and renewed appeals to rebuild our aging highways and bridges. President Obama reinvigorated the campaign with his State-of-the-Union proposal for a $50 billion program of infrastructure investments, $40 billion of which would be devoted to a "fix-it-first" program targeted at urgent improvements such as "structurally deficient" bridges. The following day, the House Committee on Transportation and Infrastructure held a hearing on "The Federal Role in America’s Infrastructure," focusing on the importance of infrastructure for the U.S. economy and the federal role in its preservation and expansion. The same day, the U.S. Chamber held a "Transportation Infrastructure Summit," a day-long gathering to explore "transportation infrastructure challenges and promising solutions" with prominent industry representatives. Yet another meeting, this one convened by Rep. Rosa DeLauro (D-NY), a longtime proponent of a National Infrastructure Bank, will explore innovative strategies for financing infrastructure in a March 18 forum on Capitol Hill.
Two recent reports have added to a sense of urgency about America’s deteriorating infrastructure. The Building America's Future coalition has published a report, Falling Apart and Falling Behind, urging development of a long-term national infrastructure strategy, establishing a National Infrastructure Bank and lifting restrictions on tolling. The American Society of Civil Engineers (ASCE) has released a report, Failure to Act: The Impact of Current Infrastructure Investment on America's Future, warning that if the investment gap is not addressed, the economy is likely to suffer $1 trillion in lost business and a loss of 3.5 million jobs. ASCE's 2013 Report Card for America's Infrastructure, a detailed analysis of the performance and condition of America's infrastructure to be released on March 19, may be expected to reinforce this gloomy forecast (a previous "report card," issued in 2009, gave the U.S. infrastructure an unflattering grade of D.)
What kind of impact this flood of warnings and advocacy efforts will have on public opinion and on congressional attitudes and fiscal decisions remains to be seen. They come at a time of severe budget pressures and intense Republican efforts to curb excessive discretionary spending. To be successful, the pro-infrastructure campaign must persuade fiscally conservative lawmakers that there are urgent reasons for a boost in spending on public works that override the imperative to reduce the deficit and get the nation's fiscal house in order.
Further, infrastructure advocates must convince the nation's taxpayers--- who see no visible signs of "crumbling infrastructure"--- that spending more on transportation will not be wasted but will result in concrete benefits in the form of reduced congestion or shorter commutes. Infrastructure alarmists also must contend with a public that lately has grown skeptical about warnings of catastrophic consequences of minor cuts in spending.
Lastly, the advocacy campaign must overcome a cynical perception that pressures to increase funding for transportation are nothing more than special interest pleadings of interest groups that stand to profit from higher levels of public spending. As one transportation advocate at a recent conference observed, "there is an enormous disconnect between us and the American public" --- a disconnect that may not be easy to overcome.
Significantly, improving the nation's infrastructure was not a topic of discussion at the President's meeting with Senate Republicans, according to Sens. Roger Wicker (R-MS) and Orrin Hatch (R-UT), as reported in POLITICO. The President must have come to a conclusion that his $50 billion infrastructure plan stands no chance of winning a favorable Senate vote ---not to mention being an anathema with the House Republicans.
A Reasoned Approach
No one disputes the infrastructure advocates’ claim that some of America’s transportation facilities are reaching the limit of their useful life and need replacing. Nor does anyone disagree about the need to expand infrastructure to meet the needs of a growing population. But fiscal conservatives among these advocates (and we count ourselves among them) contend that this does not rise to the level of a national crisis requiring a $50 billion crash program as proposed by the President, or a two trillion dollar infrastructure investment program over fifteen years as recommended by ASCE .
The condition of infrastructure varies widely from state to state as studies by the transportation research group TRIP and by the Reason Foundation have shown. Most states maintain their transportation assets in a state of good repair and only a few need extensive modernization. "There are still plenty of problems to fix, but our roads and bridges aren't cumbling," said David Hartgen, lead author of the Reason study. "The overall condition of the public road system is getting better and you can actually make the case that it has never been in better shape." Hartgen's conclusion is backed by a detailed study of the condition of America's roads and bridges. The study is based on a variety of sources, primarily from the states themselves as reported to the federal government from 1989 through 2008. ( "Are Highways Crumbling? State and U.S. Highway Performance Trends, 1989-2008, Reason Policy Study 407, February 2013).
The generally acceptable condition of the nation's transportation infrastructure in most places, argues for a more selective approach. Rather than launching a new massive national public works program in the name of "fix-it-first," state-level efforts should be targeted specifically at aging facilities that are in a demonstrable need of replacement or modernization. "The nation simply cannot afford blindly to throw money at the problem," in the words of one senior congressional Republican. "We have learned from the Administration's $8 billion high-speed rail fiasco that scattering resources in an unfocused manner in order to satisfy demands for geographic equity, leads to imprudent, irresponsible and often downright wasteful spending."
To the extent that large-scale multi-year megaprojects demanding billions of dollars still figure on the drawing boards of state DOTs, they can---indeed, they will ---be financed through public-private partnerships, tolling and credit instruments such as TIFIA and state infrastructure banks. They include the I-495 Beltway Hot lanes project in Virginia, New York's Tappan Zee Bridge replacement, the San Francisco Bay Bridge Eastern Span replacement, the I-5 Columbia River Crossing, the Highway 520 floating bridge in Seattle, the Miami Port Tunnel, the Midtown Tunnel linking Norfolk and Portsmouth VA, and two Ohio River bridges in Louisville, a joint undertaking of the Indiana and Kentucky DOTs. All of the above projects will be financed with long-term obligations rather than funded on a pay-as-you-go basis through annual congressional appropriations.
A transition from funding to financing of major transportation infrastructure projects was also the preferred approach of the financial practitioners and analysts assembled at the October 2012 conference on Public-Private Partnerships convened by the American Road and Transportation Builders Association (ARTBA). The most practical way to build future transportation megaprojects, these experts concluded, will be through project financing and public-private partnerships.
In sum, the Highway Trust Fund no longer can serve as a source of capital for new infrastructure, and funding large capital-intensive projects with current user fee revenues on a pay-as-you-go basis is no longer feasible. Instead, look for the states to assume responsibility for remedial "fix-it-first" activities, and for a shift from funding to financing for multi-year construction megaprojects. This may turn out to be the only practical long-term solution to our transportation funding dilemma.
The website nerdwallet.com mixes apples and oranges in producing a list of the 10 worst "cities" for car drivers in the United States. The ratings hardly matter, since the nerdwallet.com score is based on a mixture of urban area and municipality data.
The Apples: Nerdrwallet.com uses the Texas Transportation Institute traveled the may delay measures for urban areas. These are areas of continuous urban development that always include far more population than is in the central city or municipality. There is no data for the traffic congestion measures at the central city level. These traffic congestion scores are nerdwallet.com's "apples."
The Oranges: The oranges of the population densities for the core municipalities. For example, the density shown for New York is that of the city, at 27,000 per square mile. The urban area has a density of approximately 5000 per square mile.
The Comparison: The net effect is that nerdwallet.com uses the city of New York, with its 8 million people in approximately 300 square miles to the New York urban area with approximately 18 million people in 3,400 square miles. These are not the same things and any score derived from the mixing of these two definitions is inherently invalid.
This is one of all too many examples of comparisons that are made in the press between "cities," with editors and fact checkers taking insufficient care to ensure that they are using comparable data.
|