NewGeography.com blogs
“California Commuters Continue to Choose Single Occupant Vehicles,” according to a report by the California Center for Jobs and the Economy. The Center indicated:
“The recent release of the 2014 American Community Survey data provides an opportunity to gauge how California commuters have responded to this shifting policy. The data clearly reflects that even with the well-documented and rapidly rising costs of the state’s traffic congestion and costs associated with the deteriorating condition of the state’s roads, California workers continue to rely on single occupant vehicles for the primary mode of commuting. Moreover, their reliance on this mode of travel continues to grow both in absolute and relative terms (emphasis in original).
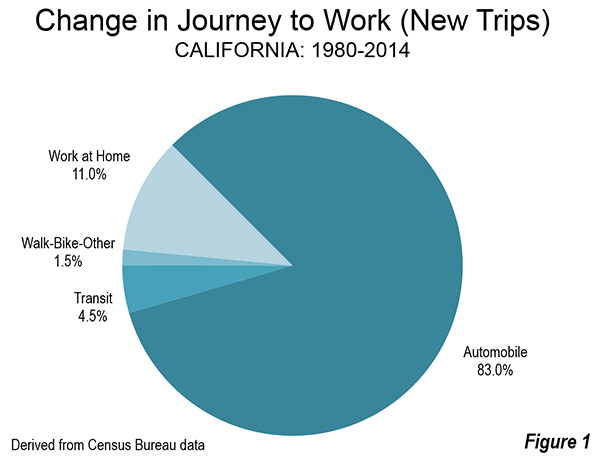
California has experienced substantial growth since 1980. There are approximately 7,000,000 more workers today than 35 years ago. The Census Bureau data shows that 83 percent of the new commuting has been by single-occupant automobile. Working at home accounted for 11 percent of the new commuting, while transit accounted for less than one half that figure, at 4.5 percent (Figure). In 1980, transit accounted for more than three times the volume as working at home. By 2014, the number of people working at home exceeded that of transit commuters.
The Center noted that state policies to discourage single-occupant commuting had been of little effect:
“The substantial investments in public transit, bike lanes, and other alternative modes have not produced major gains in commuter use. Instead, these investments appear to have simply shifted the choices made by commuters who already are committed to getting to work through modes other than single occupant vehicles. From 1980 to 2000, public transit use grew by 116,000 while “other” modes dropped by the same amount. From 1980 to 2005, public transit use grew by 121,000 while “other” modes dropped by 113,000. In the following years, 1/3 of the growth in public transit and “other” modes was offset by reductions in carpool use.”
The report credited impressive public transit gains in the San Francisco Bay Area, but went on to say that:
“even in the Bay Area, growth of public transit and the “other modes” has come largely from the shrinking relative use of carpooling.”
While improving transit ridership is a good thing, to the extent that it removes passengers from car pools, there is no gain in traffic, because the car and driver are still on the road.
The report laid considerable blame on the cost of houses in California:
“California, the growing body of land use, energy, CEQA, and other regulations affecting housing cost and supply has put both the cost of housing ownership and rents within traditional employment centers out of the reach of many households.”
California’s housing affordability is legendarily desperate. Since the imposition of strong land use regulations began in the early 1970s, the median house price has risen from three times (or less) times median household incomes in of the state’s metropolitan areas to over nine times today in the San Jose and San Francisco metropolitan areas, over eight times in the Los Angeles and San Diego areas and over five times in the Riverside-San Bernardino area (Inland Empire).
Perhaps the most important “take-away” from the report was that: “The current de facto policy of trying to reduce commuting by increasing congestion and its associated costs to commuters has to date not shown itself to be successful.” Simply stated, the vast majority of jobs and destinations in all of California’s urban areas are not accessible by transit in a reasonable time. The question for most California commuters is, for example, not whether to drive or take transit to work, but whether to go to work at all, since most jobs are not readily accessible except by car.
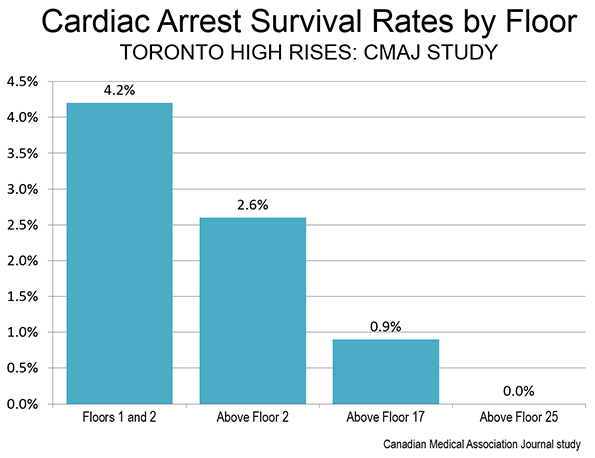
A study in the Canadian Medical Association Journal (CMAJ) indicates that the survival rates of cardiac arrest (heart attack) is considerably worse at higher floors. Survival rates were compared by residential floor in Toronto. The article implied that the longer time necessary to reach patients after having arrived on the scene was likely a factor. Further, it was suggested that the longer time required to reach the hospital from the higher floors could be a factor, since cardiopulmonary resuscitation (CPR) is suboptimal until the patient is in the hospital.
The study examined “911” response calls to high rise residential buildings in Toronto and found that the best survival rates were on the first and second floors (4.2 percent). Above the second floor, the survival rate was 40 percent less, at 2.6 percent. Above the 16th floor, the survival rate dropped 80 percent from the first and second floor (0.9 percent). There were no survivors above the 25th floor (Figure).
The study concluded: “With continuing construction of high-rise buildings, it is important to understand the potential effect of vertical height on patient outcomes after out-of-hospital cardiac arrest.”
New research by London school of economics Professor Christian Hilber and Wouter Vermeulen of the Netherlands Bureau for Economic Policy Analysis provides strength and evidence of the connection between high housing prices and strong regulatory constraints. The paper advances the science by estimating the share of house price increases attributable to regulatory constraints. Hilbur and Vermeulen show that supply constraints are considerably more important in driving up house prices than the physical constraints (such as lack of land or topography) and lending conditions or interest rates:
"In a nutshell, in our paper we use this unique data to test our prediction that house prices respond more strongly to changes in local demand in places with tight supply constraints. In doing so, we carefully disentangle the causal effect of regulatory constraints from the effects of physical constraints (degree of development and topography) on local house prices, holding other local factors constant and accounting for macroeconomic fluctuations induced, for example, by changing lending conditions or interest rates."
Their conclusions are based on analysis of housing markets in the United Kingdom since 1979. Unlike the United States, Canada, Australia or New Zealand, the United Kingdom was fully engulfed by urban containment regulatory policy by that time.
Perhaps the most important advance of the research was the author’s quantification of developable land. This is a relatively new direction in research, with perhaps the most important early contribution from Alberto Saiz of Harvard University, whose estimates relied on the assumption of a 50 mile radius of land from the cores of US metropolitan areas. My response doubted the usefulness of measuring housing markets with a fixed radius, not least because since some metropolitan areas (and even built-up urban areas) extend beyond that distance. Hilbur and Vermuelen avoid this problem by estimating developed land by local authority area, which allows for analysis at the housing market level (which is usually larger than the local authority area).
The authors also note recent research on the consequences of land use regulation to economic growth and stability. These include Hseih and Moretti, who found that without tight housing regulation, the gross product in the median city might be nearly 10 percent higher, and Glaeser et al research showing the greater volatility of prices in a tightly regulated environment.
The authors summarize the problem:
"Absent regulation, house prices would be lower by over a third and considerably less volatile. Young households are the obvious losers, yet macroeconomic stability is also impaired and productivity may suffer from constrained labour supply to the thriving cities where demand is highest."
This is important research in a world struggling to restart healthy economic growth and reverse the decline of the middle-income standard of living.
That's what the Honolulu Star Advertiser calls it in an April 8 editorial entitled "Rising Rail Chaos Bodes Ill for Us All." Honolulu’s urban rail project has experienced a host of problems, which were described by University of Hawaii professor Panos Prevedoros in January, who called the project “the nation’s largest infrastructure fiasco by far” on a per capita basis.
Things continue to deteriorate, as the Star-Advertiser editorial indicates. The Star Advertiser reported that city Council chairman Ernie Martin called for both Honolulu Authority for Rapid Transportation (HART) Board Chairman Don Horner and chief executive officer Dan Grabauskas.
In a letter, Martin expressed concern that: “With mounting evidence of mismanagement and out of control costs … it is clear that we need a leadership team capable of moving this multibillion (dollar) project forward.”
In its editorial, the Star Advertiser noted: “HART officials acknowledged new misgivings that the recently approved extension of the funding mechanism — Oahu’s 0.5 percent general excise tax surcharge — would cover the bills.”
Martin called it a “stunning about face” that Horner could not promise Council members that there would be enough cash to finish the project. Previously, according to Martin, Horner had said that the tax extension would be sufficient to finish the 20 mile line.
Martin went on to say that “we need to go in a different direction” to help “stop the bleeding.” He added: “We’re at the tourniquet stage right now,” “If we don’t apply more intense scrutiny, then we’re likely to lose limbs.”
Meanwhile, Honolulu is not alone. There has been plenty of bleeding with respect to expensive urban rail projects. In Los Angeles, $16 billion has been spent to build a massive new urban rail system and yet, transit ridership languishes below the levels of three decades ago, despite population growth. In Toronto, the new airport express train has been such a failure in ridership that it is routinely called a “fiasco” by the media.
Of course, all of this is predictable. Often, urban rail costs more and carries fewer riders than projected. are higher than projected ridership lower than projected, and virtually never high enough to reduce traffic congestion can be characterized as routine, as the international research led by Oxford professor Bent Flyvbjerg has indicated.
But Honolulu is a special case as well. There may have never been so intense a volunteer campaign to stop what was perceived as a boondoggle is in Honolulu. The Star-Advertiser, usually a cheerleader for the project, concluded by saying: “Reports of this dysfunction just adds to the strain taxpayers feel right now, and it’s the last thing they need. The price tag on the state’s largest public works project is past the $6 billion mark and rising, with the most complicated part of the work still looming.”
Why would companies located in one of the most beautiful states in the country – California – undertake the costly proposition of relocating to places with less scenic appeal and less-than-ideal weather?
There are three answers and they relate to California’s business environment: Regulations, taxes and anxiety.
Let’s take anxiety first. Corporate leaders and business owners fear what will happen in the future regarding proposals to raise taxes on business property, extend the Proposition 30 taxes that were supposed to be “temporary,” raise cap-and-trade fees to curb carbon emissions, and impose new workplace regulations regarding family leave and health care. We’re talking about billions of dollars in new operating and ownership costs.
Some of those proposals were defeated this year. But the energy level of the zealotry in California’s legislature means they are certain to rise again in 2016 and 2017. Projecting the resulting cost and complexity in future operations causes leaders in corporations and small businesses to worry – then they worry some more over the unpredictability of it all.
About taxes: This could be discussed for hours, but suffice to say that the Tax Foundation's 2015 State Business Tax Climate Index lists California at No. 48.
The regulatory environment can be brutal. Examples include fines for trivial errors such as a typo on a paycheck stub – not on the check, just the stub – and putting into law costly overtime provisions that in most states aren’t codified in a statute.
Last year, when Gov. Jerry Brown was asked about business challenges, he revealed his aloofness by saying, “We’ve got a few problems, we have lots of little burdens and regulations and taxes, but smart people figure out how to make it.” The Wall Street Journal responded: “California’s problem is that smart people have figured out they can make it better elsewhere.”
In short, California is so difficult that companies relocate entirely or, if they keep their headquarters here, find other places to expand.
In an effort to offset Sacramento’s head-in-the-sand approach to business concerns, my firm completed a new study that provides details of business disinvestments in the state. Over the seven-year period that includes last year, the study estimates that 9,000 businesses disinvested in California in favor of other locations.
The study shows that 1,510 California disinvestment events have become public knowledge and provides details on each and every event. Site selection experts I've been in touch with conservatively estimate that a minimum of five events fail to become known for every one that does. One reason is that when companies with fewer than 100 employees relocate it almost never becomes public knowledge. Hence, it is reasonable to conclude that about 9,000 California disinvestment events have occurred in the last seven years.
Los Angeles County #1 in Losses
The study found that the Top Fifteen California counties with the highest number of disinvestment events put Los Angeles with the most losses at No. 1, followed by (2) Orange, (3) Santa Clara, (4) San Francisco, (5) San Diego, (6) Alameda, (7) San Mateo, (8) Ventura, (9) Sacramento, (10) Riverside, (11) San Bernardino, (12) Contra Costa tied with Santa Barbara, (13) San Joaquin, (14) Stanislaus and (15) Sonoma.
The report excluded instances of companies opening new out-of-state facilities to tap a growing market, acts unrelated to California’s business environment. It also points to shortcomings in Federal and state reporting systems that result in underreporting of business migrations. Those factors reduced the number of California losses.
It is easy to verify circumstances described in the report since every disinvestment event is public information, is outlined in detail and sources are identified in endnotes.
When a company launches a site search, it always wants to examine potential costs. I’ve seen many business people smile upon learning that operating cost savings are between 20 and 35 percent in other states. By the way, the appeal isn’t necessarily to the lowest-cost states, but to lower-cost states with the proper workforce.
Winning Locations
The Top Ten States to which businesses migrated puts Texas in the No. 1 spot, followed by (2) Nevada, (3) Arizona, (4) Colorado, (5) Washington, (6) Oregon, (7) North Carolina, (8) Florida, (9) Georgia and (10) Virginia. Texas was the top destination for California companies each year during the study period.
Metropolitan Statistical Areas (MSAs) benefiting from California disinvestment events, in the order starting with those that gained the most, are: (1) Austin-Round Rock-San Marcos, (2) Dallas-Fort Worth-Arlington, (3) Phoenix-Mesa-Scottsdale, (4) Reno-Sparks, (5) Las Vegas-Paradise, (6) Portland-Vancouver (WA)-Hillsboro, (7) Denver-Aurora-Lakewood, (8) Seattle-Tacoma-Bellevue, (9) Atlanta-Sandy Springs-Marietta and (10) Salt Lake City tied with San Antonio.
Offshoring still occurs, and the Top Ten Foreign Nations that gained the most put Mexico at No. 1, followed by (2) India, (3) China, (4) Canada, (5) Malaysia, (6) Philippines, (7) Costa Rica, (8) Singapore, (9) Japan and (10) United Kingdom.
Capital diverted to out-of-state locations totaled $68 billion, a small fraction of actual experience because only 16 percent of public source materials provided capital costs for the 1,510 events. Moreover, the top industry to disinvest in California is manufacturing, a capital-intensive sector, and more detailed knowledge of this industry alone would likely increase the capital diversion.
As California companies relocated or expanded facilities elsewhere they transferred more than capital – they also shifted jobs, machinery, taxable income, intellectual capital, training facilities and philanthropic investments.
Indicators are that California’s business climate will worsen, enhancing prospects that more companies will seek places that are friendlier to business interests.
The report is based exclusively on news stories and company reports to the U.S. Department of Labor, the Securities and Exchange Commission and the California Employment Development Dept. Although all entries are based on public information, it’s rare for so much data to be gathered into one report.
Read the full study: “Businesses Continue to Leave California - A Seven-Year Review” available as a PDF here.
Joseph Vranich is the Principal of Spectrum Location Solutions, a Site Selection firm that helps companies identify optimum locations to accommodate growth or to improve competitiveness. In doing so, he conducts an in-depth analysis of business taxes, the regulatory climate, labor rates and lifestyle factors.
A fast growing economy usually requires a growing working-age population. It is informative in this regard to look at the size of the working-age population (wap) for different regions and countries of the world.

This data, compiled from the UN’s World Population Prospects – the 2015 Revision, tells us the following:
- The wap of Europe, the US and Japan experienced healthy growth between 1960 and 1990. After 1990, it started to decline in Japan and to stagnate in Europe but it continued to grow in the US.
- Based on the UN’s ‘medium variant’ forecast, the wap of Europe will decline steadily for the rest of this century, from 492 million in 2015 to 405 million in 2050. Barring a massive inflow of immigrants or a sharp rise in the birth rate, France’s wap will flatline and Germany’s will fall by 23% in 2015-2050.
- The US wap will grow for the rest of the century, but at a much lower rate than in the years 1960-2015. See this table for average annual growth rates:

- The wap of the BRIC countries experienced strong growth until 2015, but it will be flat from hereon. Only India’s wap will continue to grow. Brazil’s will be flat while China’s and Russia’s fall sharply.
- Last but certainly not least, the wap of sub-Saharan Africa will continue to boom, adding 800 million people in the next 35 years.
- Looking at the entire world picture, the wap will grow by 1.27 billion in 2015-2050, which is a slower rate of growth than in the past. The vast bulk of this addition will come from sub-Saharan Africa, India and a few other Asian countries.

In the 25 year interval 1990-2015, the wap of BRIC countries grew by 650 million, driven by India, China and to a lesser extent Brazil. The question now is whether sub-Saharan Africa and India can translate their own booming wap into rapid and sustainable economic growth. With developed and BRIC countries slowing down, the world economy depends on it.
This piece first appeared at Populyst.com.
Detroit's downtown is gentrifying— or, to be more accurate, a very small portion of the 139 square miles that make up the city is doing so, as it becomes populated by a new generation of workers. But the city's vast, remaining area is mostly blighted. A massive effort has been made to remove substandard and neglected homes, creating large sections ripe for redevelopment. We believe that a model community for families could be built within that devastated area, and we've launched a kickstarter campaign to get development going. You can look at this idea in detail on our new video, too: https://www.youtube.com/watch?v=cGOY_04k7Vw. A minimum land area of fifty acres would be a significant enough mass to provide a sustainable approach to growth. Here's what we would like to see:
At Rick Harrison Site Design Studio our redevelopment model is vastly different from existing models that either want to turn Detroit into farmland, or to place the existing population into high-rise projects. Both those approaches would need subsidies to be achieved. Our model takes a 'market focused' approach that is competitive with the cookie-cutter housing of the surrounding suburbs.
The plans we've developed at well over 900 sites during the past twenty-five years have averaged a 25 percent reduction of infrastructure, compared to conventional design. This reduction of street paving and utility mains has translated into increased green space per resident. For Detroit, our goal is to eliminate 60 percent or more of the existing infrastructure, and recapture the right-of-ways for residents. That will enable us to increase density while also increasing space.
We will start from scratch and design the main trails first. The street system will reduce both time and energy, compared with designs in the surrounding suburbs. All the homes will have interior floor plans and living spaces that coordinate with adjacent open spaces and views. And every home will have an energy savings HERS rating of 50 or better, so more of the resident funds can be used for better living, rather than going towards energy that escapes from a chimney. Elegant, meandering walkways will connect every home to the main trail system.
A half-century ago Detroit was America’s model city. Then, segregation and racial tensions led to the riots of 1967, which created a mass exodus to the suburbs. Those residents and businesses that could afford a new home on a large lot left the city. I began my planning career in 1968, designing those Detroit suburban subdivisions.
Let’s make Detroit a leader again by increasing living standards, connectivity, property values, tax base, open space, density, and safety while significantly decreasing construction costs, environmental impacts, energy usage, and the enormous infrastructure that currently plague the city. Detroit was once an inspiration for other cities. We'd like to make it an inspiration again.
Wodonga (Victoria) mother of two Mel Wilson has made headlines across Australia with an open letter to Federal Treasurer Joe Hockey on housing affordability. In commenting on Australia's housing affordability crisis, the Treasurer has told a press conference "The starting point for a first home buyer is to get a good job that pays good money."
Australia has a severe housing affordability problem. As the Demographia International Housing Affordability Survey showed in January, Sydney median house prices had reached 9.8 times median household incomes of by the third quarter of 2014. In the intervening months house prices have escalated so much that some say the median price will soon pass $1 million.
It was not that long ago that house prices were far more reasonable in Australia. Nationally, in the early 1990s, house prices averaged around three times incomes. Since that time, house prices have more than doubled relative to incomes. This is placed a considerable burden on purchasing households, especially first home buyers.
Ms. Wilson incredulously took Treasurer Hockey through the economics of buying a first house in Sydney. She reminded him that it would take all of the average wage earner's take home pay for four years to save the down-payment on the median house, now priced at A$915,000 (approximately US$700,000. The entire letter is published below.
In a later statement, the Treasurer, to his credit, indicated the need for strong lobbying of the states to make more land available to increase supply. The problem in Sydney and Australia is not unique. Similar house cost crises have developed from London to Toronto and San Francisco, where governments have severely limited the land that can be used for new residences, with the wholly predictable result that prices escalate out of control.
Ms. Wilson, and other concerned (or baffled, as Ms. Wilson puts it) Australians should hope that Treasurer Hockey's "strong lobbying" is successful. The economic reality is that until there is liberalization of the land use restrictions responsible for much of the housing cost escalation, there will be no relief, other things being equal. Indeed, house prices are likely to just keep going skyward. This requires a mid-course correction toward policies that place improving the standards of living and reducing poverty at a higher priority than urban design.
---
Letter from Ms. Mel Wilson to Treasurer Joe Hockey:
Dear Joe,
I just wanted to touch base with you regarding your comment that young people are able to enter the property market if they just “get a good job that pays good money.”
I just wanted to ask you how one might go about this?
Are you going to be reviewing all the current Awards that are in place to ensure that most jobs pay “good money”?
Are you going to be creating hundreds of thousands of new jobs that, under your Awards, pay over $100,000 per year?
Apologies if I have missed this fantastic news, but as someone working in 2 senior HR roles, I believe I would have known about this so that I could pass the message on to some very tired, over qualified employees who currently fall under various Federal and State awards and are being paid between $18 to $25 per hour.
Are you aware of what the average Australian wage is?
Are you aware of what the average Australian mortgage in Sydney is?
Are you aware of the first-home buying process?
Just in case these facts and figures aren’t available to you, I thought you might be interested.
The average weekly wage according to the Australian Bureau of Statistics on 1st January 2015 was $1,128.70, or $58,692.40 before tax. This means a take home amount of about $904.00 per week.
The median house price in Sydney, according to the Domain Group Housing Price Report, as of March 2015, was $914,056.
Not sure if you know how first home buying works at the moment, but you normally need a deposit of about 20%. This is to pay for the Stamp Duty (which is a State Tax you must pay every time you buy a property), and also to assist in the approval process so that you don’t need to pay Lenders Mortgage Insurance.
So in this instance, the first home buyer would need about $182,811.00 saved to purchase a house that is the average price in Sydney.
So to go out and get one of these “good jobs that pay good money” I assume these young people you speak of would need to go to university first.
On average, it takes about 3 -4 years to get a degree, so if a young person goes to University straight out of school, they can expect to finish their course and be ready for the workforce at about 21, with a HECS-HELP debt of over $20,000. To make this a bit easier for you to understand, let's say there is a young person named Joe Junior who has done just this.
If Joe Junior is extremely lucky, and is up there with the best of the graduates from that course and that year, he will get a job straight out of University paying usually under the average wage.
However, lets just be extremely generous here and say that Joe Junior got a job and was on the national weekly take home wage of $904 per week.
Joe Junior needs to only save every single dollar worked for about 4 years to save his $182,811 deposit for their first home. Thank you, Mr Hockey, for throwing in that $7,000 first home owner grant too – that meant Joe Junior could get into his first home 8 weeks earlier!
Just a quick side note, this example does not take into consideration the rising house prices, or Joe Junior’s HECS-HELP debt that he obtained from getting his degree to get one of your so-called “good jobs”.
Joe Junior is now 25 (not so junior anymore), has been living at home with his parents this entire time and has not been able to spend a single dollar on any bills, board or holidays or public transportation. He also can’t afford a car or petrol for a car but then again “poor people don’t drive cars”. Oh wait, Joe Junior isn’t a poor person – he has a “good job that pays good money.”
Luckily Joe Junior’s parents have been happy to drive their little Joe Junior to and from work every day and provide free housing, clothing, medical expenses and also provide the food for his breakfast, lunch and dinner each day.
So finally Joe Junior has saved his $182,811 deposit (of which only about half will go towards his mortgage due to the stamp duty cost), and can now purchase his first home, with a mortgage of about $822,650.00.
According to the Commonwealth Bank’s online mortgage estimator, the repayments for a mortgage of this amount are $1,073.00 per week over 30 years.
So hopefully Joe Junior’s average weekly wage of $904.00 has gone up enough to cover the cost of the mortgage.
Joe Junior has been applying for these “good jobs hat pay good money" that you speak of (I assume by "good money" you mean more than the average wage as you have just seen it is not even enough to cover the cost of the average house prices' mortgage in Sydney), but hasn’t had any luck as yet. He needed to stay in the same job post university to demonstrate to the bank job stability so that he could purchase his first home. So he only has a degree, and experience in the one job, one industry, and there are just not that many jobs out there paying “good money.”
Joe Junior now also can’t wash his clothes, eat food, or get to and from work as he no longer lives with his parents, so getting one of these “good jobs” is even more difficult.
So Joe Senior, are you really aware of all the facts and figures when you says things like buying your first home is “readily affordable” to young people?
Just slightly confused as to what you were thinking when you said these words at the media conference in Sydney.
Looking forward to another one of your politically correct, direct and well thought out responses.
Regards,
Another baffled Australian
Intercensal population estimates, while generally reliable, are prone to substantial variation in some cases. This is especially so with municipal population estimates.
Between 2000 and 2010, the average discrepancy between the US Census Bureau 2010 estimates and the 2010 census counts at the county level was 3.1% (absolute value). By comparison, among the 50 largest municipalities and census designated places, the average discrepancy was more than one-half higher, at 4.7 using the 2000 to 2009 estimates (there were no 2010 sub-county population estimates). The variations, however, can be substantial in sub-county population estimates. Between 2000 and 2010, the Census Bureau estimated that New York had added more than 410,000 residents. However, the 2010 census count showed a much smaller gain, at approximately 165,000 (2010 estimates are available for New York because it is composed of whole counties).
There were even more substantial variations. The 2009 population estimates for Atlanta and Detroit were more than 25% higher than the 2010 census count. In the case of Atlanta, the 2000 to 2009 population growth estimate was more than 120,000, more than 100 times the actual increase of approximately 1,000. The discrepancies in Atlanta and Detroit were greater than in all but a three of the nation's more than 3,000 counties and each of the counties with larger discrepancies had populations of less than 1,000 in 2010.
The Economist headline reads: "Through the roof: Rising house prices may be chiefly responsible for rising inequality"
This is no surprise to those of us who have been chronicling the loss of destruction of middle income housing affordability where urban containment policy has been implemented from Australia to Canada, Ireland, New Zealand, the United Kingdom and the United States.
Matthew Rognlie, a graduate student at the Massachusetts Institute of Technology, has critiqued the highly publicized work of Thomas Piketty (Capital in the 21st Century) to suggest that rising inequality is largely due to the accumulation of wealth in housing.
House prices have doubled, tripled or more relative to incomes, as regulators have banned or seriously limited new housing on the urban periphery. Younger households have been unable to afford houses as older households have watched their wealth increase.
The "writing" has long been on the wall. Legendary urbanist Sir Peter Hall lamented the potential abandonment of the "ideal of a property owning democracy" (see The Costs of Smart Growth Revisited: A 40 Year Perspective) under urban containment policy.
Rognlie suggests that a better title for Piketty's book would have been Housing in the Twenty-First Century. According to Rognlie: "the literature studying markets with high housing costs finds that these costs are driven in large part by artificial scarcity through land use regulation .... A natural first step to combat the increasing role of housing wealth would be to reexamine these regulations and expand the housing supply."
|


