Chapman University President Emeritus and Professor of Economics Jim Doti gave more than the red meat of prognostication at the recent mid-year update on the economic forecast from the A. Gary Anderson Center at the Argyros School of Business and Economics.
Doti also offered a couple of headscratchers to the crowd that gathered at the Musco Center on Chapman’s central-casting campus in Orange. It was the sort of stuff that takes an economist to come up with but offers a fair intellectual challenge to anyone who cares to consider the data and analysis behind the econometrics involved.
Here’s the short version: Doti told the crowd that Orange County’s housing market is a bit underpriced these days.
Underpriced?
With a median price for a single-family home well above $700,000?
Yes, declared Doti, who backed up his contention with some research by a class of Chapman students under his supervision.
The research was based on four key data points produced with the application of regression analysis to assign dollar values to certain aspects of OC’s housing market.
All of that was factored into an equation to compare OC with 107 other metro markets across the U.S., as measured by the federal government as of 2016, the most recent data available.
The four factors were:
• Median prices for single-family homes, as reported by the U.S. Census Bureau
• Median household income, as reported by the Bureau of Economic Analysis of the U.S. Department of Commerce
• A score for natural amenities that considers factors such as weather and other quality-of-life conditions, as reported by the U.S. Department of Agriculture
• Pacific Ocean shoreline
The analysis compared OC’s 2016 median home price of $733,000 to the $322,000 median nationwide.
Then it applied the regression analysis to account for the difference, figuring how much a higher median income, plentiful natural amenities such as a Mediterranean climate and varied topography, and 42 miles of coastline add to the value of a house in OC.
Here’s how Doti and his econometrics crew figured it:
Take the national median home price of $322,000.
Consider that OC’s median household income was $86,000, about 25% higher than the national level of $68,800. Factoring that in as part of a mean-regression calculation adds $137,000 to the price of a home in OC, based on a broader market of would-be buyers able to pay more.
Also consider OC’s amenities score of 8.74 from the USDA compared with an average 3.05 for the 3,142 counties throughout the U.S. That’s good enough, according to Doti’s analysis, to tack another $95,000 to the price of a home in OC.
Then there’s the proximity to the Pacific Ocean, which adds another $194,000 to the market for OC homes.
Add it up: $322,000 + $137,000 + $95,000 + $194,000=$748,000.
That’s slightly more than the median of $733,000 recorded for 2016.
And that’s economics – as explained by Doti with the help of some econometrics that help drill down on the supply and demand of OC, where homes are so expensive in no small part because the market is so attractive.
Anyone else notice that Orange County continues to square up on homelessness in a way that escapes neighboring Los Angeles?
Sure, LA’s challenge is larger. But so are the resources that both the City of LA and County of LA have at their disposal.
The least LA officials could do is check out what seem to be some best practices in OC, from the court order that led to a genuine effort to find housing for homeless folks living along the Santa Ana River to a new program aimed at helping military veterans off the streets.
The program for vets stems from Assemblywoman Cottie Petrie-Norris’ success in getting $2.9 million from the state budget for the current fiscal year for the Welcome Home OC program of United Way. The program involves the County of Orange, Orange County Housing Authority, the Apartment Association of Orange County, individual property owners and various service providers.
The money from the state will be used to provide homeless individuals with vouchers for rental assistance in OC. United Way has lined up owners of private property to participate in the program.
The most recent count of homeless folks in OC brought an estimate of 312 vets.
There currently are two projects in the works and on track to deliver a combined 124 units of housing for homeless vets. The rent vouchers under the $2.9 million for the Welcome Home OC program are expected to be enough to get the remaining 188 homeless vets into existing rental units for a year.
That comes to about $15,500 per person for the voucher program.
Compare the benchmark of the OC program with the more than $600 million budget of the City of LA – and there was more spending by the County of LA – for programs that led to a net increase of 11,400 homeless individuals getting housed last year. The increase is based on a comparison with the annual totals of homeless individuals getting housing in 2014, before voters approved extra taxes to raise billions of dollars for city and county programs.
The cost in LA comes to a minimum of $38,771 per person, about 150% higher than OC – and that’s before you even factor in the county’s spending alongside the city’s budget.
Perhaps LA could send a contingent down to OC to study best practices, especially when it comes to deploying the assets of the private sector in matching some segments of the homeless population with existing rental units.
Most Houstonians are familiar with Houston's most famous piece of graffiti, the "Be Someone" message in giant letters on the Union Pacific bridge over I45 north of downtown. It's gone through a lot of iterations and defacement over the years, including recently, but the fact that it keeps coming back is a testament to its popularity. Long ago I did a post here titled "What message is your city telling you?" discussing an essay by Paul Graham (of Y Combinator fame). His basic theme is that each city has its own subtle message it's sending you about what's important and how you should direct your ambition.
Here are some of his examples:
New York: "You should make more money."
Boston/Cambridge: "You should be smarter." (or at least better read)
Silicon Valley: "You should be more powerful." (i.e. change the world)
"Cambridge as a result feels like a town whose main industry is ideas, while New York's is finance and Silicon Valley's is startups."
SF/Berkeley: "You should live better." (more conscientious, more civilized, better 'quality of life')
LA: "You should be more beautiful and famous."
DC: "You should know more important people."
Paris: "You should do things with more style."
London: "You should be more aristocratic." (higher class - although he says this signal is weaker than it used to be)
Here's the summary list of messages he came up with:
"So far the complete list of messages I've picked up from cities is: wealth, style, hipness, physical attractiveness, fame, political power, economic power, intelligence, social class, and quality of life."
And here's what I came up with at the time for Houston:
"So what about our little town of hard working engineers and entrepreneurs? The city of Canion, Cooley, DeBakey, and a gaggle of energy and real estate mavericks? Well, I think we can rule out style, hipness, physical attractiveness, fame, political power, intelligence, social class, and quality of life. Wealth, maybe a bit, but I think the primary one is economic power - "You should be a bigger player in business."(even the business of medicine) We don't seem to care too much whether you're an entrepreneur, developer, or top executive - just so long as you're a big shot. And if you're not a big shot, the message is to become one by whatever path necessary - whether on your own or through a large organization.
Maybe not the ideal message I'd choose (although not bad), but I think it's an accurate reflection of the culture of the city."
Later my friend Anne suggested maybe "industriousness" is a better ambition message for Houston rather than "economic power", because it's more inclusive of people working hard in all sorts of endeavors, including nonprofits. Both of those certainly fit well with a "Be Someone" motto encouraging people to go out and make a difference in the world.
I think it would great for the city to embrace "Be Someone" as our official motto and start baking it into our identity as a city (cue the T-shirts). It's a great message we could put just about everywhere. A similar example of an inspiring motto is "Live a Great Story". On a practical note, that probably means cleaning up the sign and protecting it from future defacement, maybe with a protective spray-paint-repelling clear coat and/or some sort of physical protective shield added to the bridge. But the real value is beyond the sign itself, but in the collective sense of identity it can unify Houstonians around.
Would love to hear your thoughts in the comments...
A new report by Edward Pinto of the American Enterprise Institute (AEI), which rates the “Ten Best and Worst Metro Areas to Live in for Science, Technology, Engineering, and Math (STEM) Jobs,” comes to some apparently surprising conclusions (full report). Pinto, Co-director of the AEI Center on Housing Markets and Finance considers the 30 metropolitan areas with the most STEM jobs, and considers three factors, (1) the number of STEM jobs, (2) job growth since 1990 and (3) relative housing affordability for first time home buyers. Job growth is included as a measure of economic vibrancy. Pinto explains the inclusion of housing affordability.
On one hand, some metro areas with relatively high home prices are desirable places to live in terms of jobs and local amenities. On the other hand, house prices may be higher than they really need to be due to local policies that needlessly drive up the price of land and thereby constrain the amount of new housing. Households should be aware of these tradeoffs.
All of the top four metropolitan areas are in the South, Dallas-Fort Worth, Houston, Atlanta and Austin. Chicago, with superior housing affordability, ranks unusually high at number five. Four of the bottom five are in California, Los Angeles, Sacramento, San Diego and fifth worst San Jose, the historic world leader in technology. Baltimore ranks fourth worst. Just outside the bottom five is tech leader San Francisco, at sixth worst.
The map below summarizes the rankings (see map below, used by permission).
Please continue reading the AEI findings here (full report).
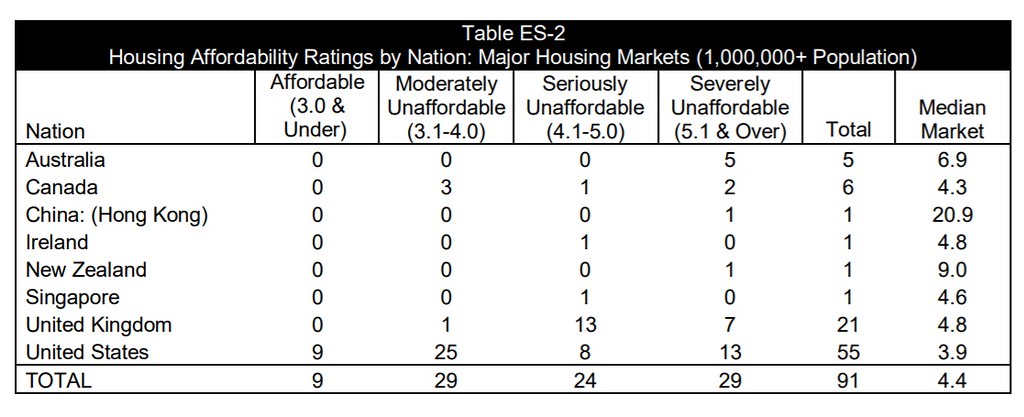
The 15th Annual Demographia International Housing Affordability Survey covers 309 metropolitan housing markets (metropolitan areas) in eight countries (Australia, Canada, China [Hong Kong Only], Ireland, New Zealand, Singapore, the United Kingdom and the United States) for the third quarter of 2018. A total of 91 major metropolitan markets (housing markets) --- with 1,000,000+ population --- are included, including three megacities, with more than 10,000,000 residents (New York, London and Los Angeles).
Middle-Income Housing Affordability
The Demographia International Housing Affordability Survey rates middle-income housing affordability using the “Median Multiple,” which is the median house price divided by the median household income. The Median Multiple is widely used for evaluating housing markets. It has been recommended by the World Bank and the United Nations and has been used by the Joint Center for Housing Studies at Harvard University. The Median Multiple and other price-to-income multiples (housing affordability multiples) are used to compare housing affordability between markets by the Organization for Economic Cooperation and Development, the International Monetary Fund, The Economist, and other organizations.
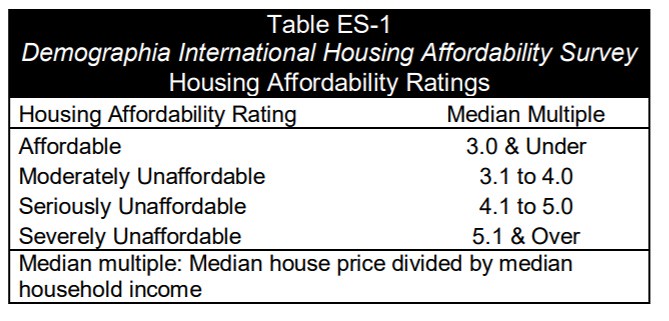
Historically, liberally regulated markets have exhibited median house prices that are three times or less that of median household incomes (a Median Multiple of 3.0 or less). Demographia uses the housing affordability ratings in Table ES-1.
Housing Affordability in 2018
Over the past year, there has been moderation of house prices in some of the most unaffordable markets. In some markets, prices have stabilized, while in others actual declines have occurred. However, none of the price declines have been sufficient to materially improve housing affordability. These developments could, in the long run, simply be further indication of the price volatility exhibited associated with stronger land use regulation.
There are 9 affordable major housing markets, all in the United States. There are 29 severely unaffordable major housing markets, including all in Australia (5), New Zealand (1) and China (1). Thirteen of the major markets in the United States are severely unaffordable (out of 55), seven in the United Kingdom (out of 21 major markets) and two out of Canada’s six.
The most affordable major housing markets are in the United States, with a moderately unaffordable Median Multiple of 3.9, followed by Canada (4.3) and Singapore (4.6). Ireland and the United Kingdom both have Median Multiples of 4.8. The major markets of Australia (6.9), New Zealand (9.0) and China (20.9) are severely unaffordable (Table ES-2).
There are 9 affordable major housing markets, all in the United States. Pittsburgh and Rochester are the most affordable, with a Median Multiple of 2.6. Oklahoma City has a Median Multiple of 2.7, while Buffalo, Cincinnati, Cleveland and St. Louis each has a 2.8 Median Multiple. Indianapolis (2.9) and Detroit (3.0) are also affordable.
There are 26 severely unaffordable major housing markets in 2018. Again, Hong Kong is the least affordable, with a Median Multiple of 20.9 up from 19.4 last year. Vancouver has replaced Sydney as the second least affordable, with a Median Multiple of 12.6. With slightly declining house prices, Sydney’s Median Multiple dropped to 11.7. Melbourne (9.7), San Jose (9.4), Los Angeles (9.2) and Auckland (9.0) were also among the least affordable. San Francisco (8.8), Honolulu (8.6), as well as London (Greater London Authority) and Toronto (both 8.3) were also among the 10 least affordable major markets. Schedule 1 includes Median Multiples for all major markets.
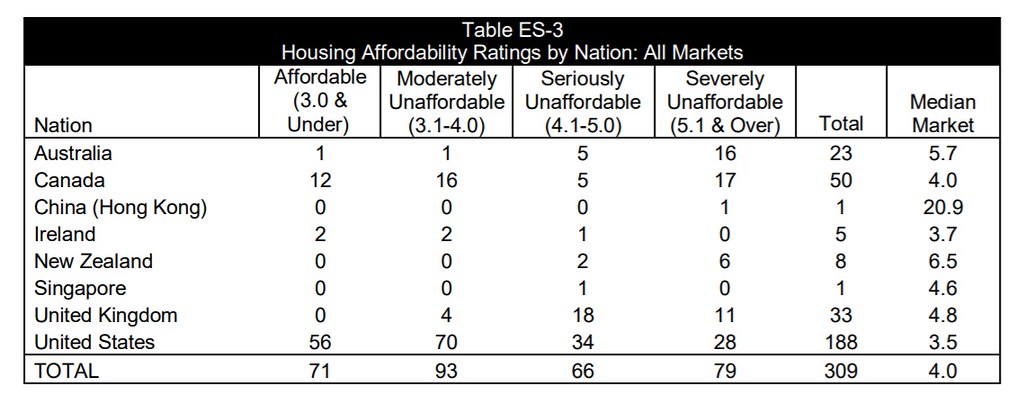
Table ES-3 summarizes housing affordability in all markets.
Well-Functioning Cities
There has been significant progress in the reduction of poverty around the world, first in the high income world and now in other nations. Paradoxically, threats are emerging in some urban areas of the high-income world, as middle-income households face intensifying economic challenges.. Much of the cause can be traced to much higher house prices.
Former World Bank principal urban planner Alain Bertaud’s new book (see Introduction: Avoiding Dubious Urban Policies) expresses concern that urban policy in cities is being driven by planning that ignores fundamental economics. This, he warns, can lead to a “costly utopia.” According to Bertaud, “The objective of the book is not to propose new urban forms but to apply already consensual basic economic principles to the practice of urban planning.”
In the environment of current urban policy, principally urban containment policy, middle-income housing has become too expensive for many middle-income households and poverty has increased. Significant national economic losses have been associated with more restrictive land use regulation.
Economists Paul C. Cheshire, Max Nathan and Henry G. Overman of the London School of Economics state the obvious priority: “… the ultimate objective of urban policy is to improve outcomes for people.” Economists Edward Glaeser of Harvard University and Joseph Gyourko of the University of Pennsylvania, have that “well functioning” housing markets are crucial to housing affordability. Housing affordability requires well functioning land markets.
Bertaud adds: “The main objective of the planner should be to maintain mobility and housing affordability” This would produce substantial opportunities, permitting residents the widest access to employment and shopping and other pursuits--- in short, well functioning cities (labor markets).
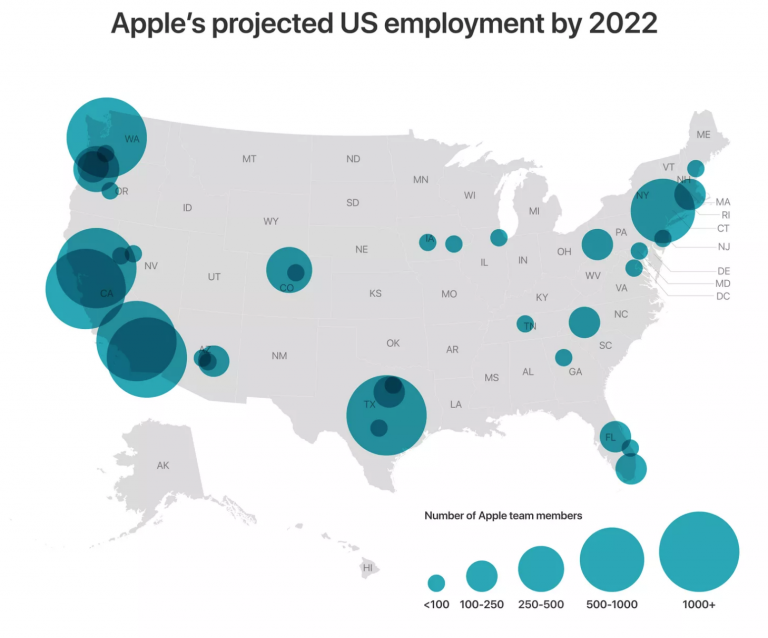
Apple has picked Austin as the site of its new $1 billion campus, one that will ultimately have 15,000 employees. The Verge has the initial details:
Along with the 6,200 employees that Apple already has in the city, its new 133-acre development is expected to make it the largest private employer in Austin. Apple expects the new campus to accommodate 5,000 employees at first, though it will ultimately have a total capacity of 15,000. The new Austin campus will handle tasks ranging from engineering to customer support for the company. Like all Apple’s other facilities worldwide, the facility will run on 100 percent renewable energy.
…
Along with its new Austin campus, Apple has also announced expansions across a number of other US cities. Seattle, San Diego, and Culver City will each grow to have over 1,000 employees apiece, and Apple also plans to expand its operations in Pittsburgh, New York, and Boulder, Colorado, over the next three years. In total, Apple employs 90,000 people across the US, and has over 1,000 employees per state across 16 states.
Once again we see a major tech company going with the “usual suspects.” Austin is not a superstar city, but is a booming Sunbelt city with a longstanding tech cluster. Apple picking Austin may help explain how Amazon ended up in Nashville over Austin.
The other places Amazon is going to are all already on the list so to speak. This map from Verge says it all about how things are playing out in American tech:
The Dallas-Fort Worth metropolitan area (DFW) will be the new headquarters of McKesson, the nation’s largest pharmaceutical distributor, the company announced this week. DFW will now have three of the top 10 companies in the Fortune 500 (ranked by total revenue). No other metropolitan area has more than one of the top 10. Dallas-Fort Worth is also home to Exxon-Mobil, the second largest company and AT&T, ranked ninth.
This continues the high-profile exodus of companies from California, with its high cost of living and Chief Executive Magazine ranking as the worst state for business. Not surprisingly, McKesson chose the state ranked as best for business, Texas.
With news that GM is closing its Lordstown assembly plant near Youngstown, I thought back to a short film I saw in grade school that made such an impression on me at the time that I never forgot it. In the wake of a strike at the plant in 1972, film makers interviewed workers at the plant and created a short documentary from it. Note at the scenes inside the plant are not from Lordstown. In fact, I think they are from a Ford plant. GM refused to cooperate with the film crew in any way, so they used other footage to give a look at life inside the plant in that era. If the video player doesn’t display for you, click over to watch on YouTube.
Another GM plant that’s closing is the one in Detroit’s former Poletown neighborhood. Steve Malanga at City Journal takes a look back at the senseless destruction of a city neighborhood carried out to build this plant that will now just become another hulking ruin in Detroit.
Maine governor Paul LePage has announced that he will move to Florida after his term expires in 2019. According to The Hill, taxes are driving the Governor away. He said: “I will pay no income tax and the house in Florida’s property taxes are $2,000 less than we were paying in Boothbay,” LePage said. “At my age, why wouldn’t you conserve your resources and spend it on family [rather] than spend it on taxes?”
According to the Wall Street Journal, New York Governor Andrew Cuomo said that young people are returning "to upstate cities such as Buffalo." The Governor continued, “This is reality, these are numbers.” Cuomo was quoted in a 27 September article on the population and economic stagnation in New York. Actually, the latest American Community Survey domestic migration data for the Buffalo metropolitan area, there was net outmigration in 2011-2015. The rate of net loss was nearly double the metropolitan area loss rate among those aged 20 to 24, and more than triple the metropolitan rate among those aged 25 to 34. That is the reality, at least according to data developed by the US Census Bureau.
Infinite Suburbia is the culmination of the MIT Norman B. Leventhal Center for Advanced Urbanism's yearlong study of the future of suburban development. Find out more.
Authored by Aaron Renn, The Urban State of Mind: Meditations on the City is the first Urbanophile e-book, featuring provocative essays on the key issues facing our cities, including innovation, talent attraction and brain drain, global soft power, sustainability, economic development, and localism.