Darwin, capital of Australia’s Northern Territory is located next to the sea, across from the Indonesian archipelago. Darwin is also located next to a sea of developable land in one of the world’s least developed nations. Only 0.3% of Australia’s land is developed, approximately 1/10th the rate of the United States or Canada (in the agricultural belt) and even less compared to European nations.
Local Officials Report Erroneous Data: Yet, Darwin has severely unaffordable housing in our 6th Annual Demographia International Housing Affordability Survey. Upon initial publication of this year’s report, local officials identified a mistake in the median house price figure that they had made available to the press (and that we had used). Rather than a median house price of $607,000 (US$510,000), they announced that the median house price in September 2009 was $499,000 (US$425,000). Officials also corrected the median house price figure for the previous quarter.
Housing Affordability: Still Dreadful” The result was that the Median Multiple (median house price divided by median household income) fell from 8.6 to 7.1. Affordable markets have a Median Multiple of 3.0 or below. As originally reported Darwin was the 4th least affordable market out of 272. We have revised our report to reflect the newly revised data. Darwin is now rated as 13th least affordable market, which is only marginally less dreadful.
Still As Unaffordable as New York or London: This was cause for celebration by the Chief Minister (Premier) of the Northern Territory, Paul Henderson, who noted that housing was less expensive in Darwin than in Tokyo. We do not know the Median Multiple for the Tokyo metropolitan area, because data is not readily available. However, Darwin is as expensive relative to incomes as New York and London.
Darwin: A Metropolitan Area in Housing Stress: At the median house price, the median household will pay half its income for the mortgage. This is well above the "mortgage stress" level of 30% as defined by government agencies. The overwhelming majority of Darwin’s future households will be faced with housing stress or could be life-long renters. The price for most residential building lots (blocks) in the new suburb of Johnston is approximately the same as the US median house price, even after adjusting for currency differences.
High Demand Markets are More Affordable: Atlanta and Dallas-Fort Worth each have added the equivalent of Darwin’s population annually during the 2000s and have exhibited far higher underlying demand for housing. Yet housing is affordable (Median Multiples under 3.0). If Darwin had the same price to income ratio as Atlanta, the median house price would be little more than $150,000.
Extinguishing the “Great Australian Dream:” It was not always this way. Before the widespread adoption of “urban consolidation” policies (also called growth management, smart growth or compact city policies), sufficient land was always available to build on across Australia. In the last two decades, however, urban consolidation policies have ravaged Australia’s household wealth, driving prices to the highest levels in the English speaking world.
Few places in the world are more unaffordable than Darwin. Few places have more land to grow. Heavy handed and stingy planning has extinguished the Great Australian Dream in Darwin.
Former chief economist of the Organization for Economic Cooperation and Development David Henderson coined the appellation, “Global Salvationism,” to describe the kind of behavior one witnesses at gatherings such as this past week’s World Economic Forum (WEF) in Davos, Switzerland. WEF was created in 1971 so that elites from around the world could gather to “map out solutions to global challenges,” according to WEF’s website. This year’s forum is entitled, “Improve the State of the World: Rethink, Redesign, Rebuild.” WEF’s program summary explains the urgency of the task facing those gathered in beautiful eastern Switzerland this way: “Improving the state of the world requires catalyzing global cooperation to address pressing challenges and future risks.” In an effort to compound jargon with alliteration, WEF uses “rethinking” in the titles of 29 conference sessions, “redesign” 16 times, and “rebuild” 9 times, for a total of nearly one-quarter of all the sessions. With all the turmoil created by the global recession and other “pressing challenges” in 2009, the world’s elites came together this week ready to re-do about everything.
Central to WEF’s annual objectives is what to do about life’s inequities and imbalances. Hardly anything warrants “catalyzing global cooperation” more than the ongoing effort to make poverty history, reduce inequality, and correct global imbalances. WEF has announced that global development is taking center stage on the third day of the event.
How ironic, then, that just prior to their gathering, Maxim Pinkovskiy and Xavier Sala-i-Martin updated findings from their 2009 National Bureau of Economic Research paper, “Parametric Estimations of the World Distribution of Income,” on the economics website VOX. Their findings show precipitous drops in global poverty since 1970—just about the same time WEF began meeting in Davos (Mark Perry wrote about the original paper here).
Between 1970 and 2006, the global poverty rate fell nearly 75 percent. During this period, the percentage of the world’s population living on less than a dollar a day fell from 26.8 to 5.4 percent. The world’s population grew 80 percent during the same period, which makes the poverty reduction all the more astounding. The global Gini coefficient, a standard measure of inequality, fell from 67.6 to 61.2 percent, indicating a drop in inequality as well as poverty. The same trend is found in other measures of inequality besides Gini.
And when one computes a measure of global “welfare” understood in the old-fashioned sense of well-being, we find that life has gotten better faster for a larger share of the world’s population than perhaps any time in history. By deriving a calculation of well-being from GDP and inequality measures, the authors show that between 1970 and 2006, global welfare more than doubled, growing faster than GDP.
The authors also consider the World Bank’s new purchasing power parity (PPP)–adjusted measures of GDP and find that while global poverty increases overall, the rate of poverty actually drops faster since 1970 than it does under more conventional GDP measures. In other words, under the PPP model, the world looks a lot poorer in 1970 than it does using more traditional measures of poverty, but today, the poverty rate is nearly the same regardless of whether one uses the PPP or more traditional measures (see the graph below). Using the World Bank’s adjustment actually has the effect of making it look like we have been doing a better job of reducing poverty over the past three decades, despite how the world looks poorer in any given year.
Now, just days before Pinkovskiy and Sala-i-Martin published their VOX article, Princeton’s Angus Deaton shot to pieces the idea that one can accurately measure global poverty and inequality across countries in his presidential address to the American Economic Association. Deaton’s argument is persuasive and serves as a good reminder that economic measures across different societies are nearly impossible to establish with perfection and complete accuracy. That said, it is interesting that Pinkovskiy and Sala-i-Martin find the same drops in poverty across the various methodologies they test. Something is going on here.
One might draw the conclusion that the precipitous drop in poverty corresponds with the beginning of the WEF meetings in 1971. Maybe the elite gathering has worked! Or, one might conclude liberalization of states and economies is working. During roughly the same period covered by the authors, the percentage of free countries in the world increased from 29 to 46 percent, according to Freedom House’s annual ratings. Liberalization and economic growth go together. One might also conclude that China’s explosive growth, which has carried Asia as a whole from 19 percent to 28 percent of the global economy during this period, has had a significant impact on poverty reduction, not to mention India’s rapid rise in its share of global GDP.
Instead of rethinking, redesigning, and rebuilding the world, WEF’s best minds might consider devoting a full day to understanding what worked the past forty years and figuring out how to “repeat” it.
The St. Louis Post Dispatch characterizes high speed rail as a “bridge to the 19th century,” in noting its opposition.
I couldn’t have said it better, though I tried in my Wall Street Journal Oped (“Runaway Subsidy Train”). As usual, some of the best lines in this article fell on the “cutting room floor,” as editors can allow only so many words. The two most important points were:
Significant community opposition is developing. Within the last 10 days there have been community and neighborhood protests against new high speed rail lines in France, Italy, Spain and Hong Kong. Further, opposition to the greenhouse gas belching Mag Lev (magnetic levitation) extension from Shanghai to Hangzhou (China) has blocked that project. There is a burgeoning opposition to the swath that high speed rail will cut through the communities on the peninsula south of San Francisco.
A traveler using high speed rail from Orlando to Tampa who gets caught at a rental car counter line might not save any time over driving even if the train reached the speed of light.
The biggest problem with high speed rail is that it requires huge expenditures of public funding in a market (intercity passenger transport) that does not require subsidies. Much of the impetus comes from generous donations to political campaigns by vendors who live off public funding and by a naive cadre of virtual sheep who believe anything that runs on rails walks on water.
Apple's much anticipated iPad tablet computer was announced today, albeit to some mixed reviews. While the iPad itself may or may not succeed, the overall technology trend line is clear: increasingly rich mobile access to the Internet and email. Oddly, this Business Week columnist thinks the iPad may lead to more telecommuting, when what it really favors is tipping the balance for commuters from driving to transit, where the usually "dead" commuting time can become really productive. Most people are already spending more than two hours a day on email and the Internet - why not put those hours at the beginning and end of the day while commuting so you can spend less time in the office and more time with your family?
A decade ago, the workplace was much more call and voice-mail driven, which matched up just fine with long driving commutes and cell phones. But the shift has moved strongly towards email and other data-driven communications (texting, Twitter, Facebook, collaboration applications, etc.). Most messages have multiple recipients and can expect to have a string of replies - something voice mail simply can't handle. People are trying to do this data-driven communication while driving, with very bad effects that are leading rapidly to a comprehensive legal ban.
As more people realize the productivity advantage of a transit commute, I think there could be a substantial shift. But it might not be quite what you'd expect. Mobile productivity favors one long ride in a comfortable seat - no transfers, no standing 'strap-hanging' (like on a subway or full light rail or local bus), and minimal walking (which is not only incompatible with mobile productivity, but also has weather risk and is especially hard on women in heels). That argues for express buses over trains. I recently met with a friend that lives in Manhattan but works in Connecticut. Does he take the subway and then ride the train? Nope - a luxury shuttle bus with wi-fi picks him (and the other Manhattan employees) up right near his apartment and drops him at the front door of work. Point-to-point express buses are the future of commuting. All you need are a couple dozen people that need to get from the same neighborhood to the same job cluster on roughly a similar schedule to justify a daily round trip - and they can all be productive the whole way, whether through individual 3G data connections on their devices or wi-fi on the bus (by far the cheapest option).
While the climate-concerned may cheer increased transit use, an ironic side effect may actually be increased sprawl. When commuting is truly unproductive time, as driving is, people really hesitate for it to be more than an hour a day, which puts a pretty hard limit on how far home can be from work. But if you can be productive on a bus doing work you'd have to do anyway, you might consider two or more hours a day commuting (as my Manhattan friend does) and look at exurban communities you wouldn't have even considered before, especially if they have more affordable or newer houses with better amenities and public schools.
This is the commute of the future, and cities that offer it conveniently, affordably, and comprehensively (all neighborhoods to all job centers) through some combination of public transit, private buses, and HOT lanes will continue to grow and thrive in the coming decades, while those that don't, won't.
Almost three years ago, shortly after graduating from college, Jeffrey Rogers found himself with a degree and no job. The economy had just taken a dramatic turn for the worse and he was struggling to get by.
“He was literally living off peanut butter and jelly sandwiches,” said Kathryn Rogers, his younger sister and a first-year graduate student at Chapman University in Southern California.
Jeffrey went to their father for help in a last-ditch effort to meet his monthly living expenses, but his Dad refused. “He definitely is into tough love," said Kathryn. “He said, ‘He’ll make ends meet in one way or another...' [his] attitude is, ‘Once you graduate, you’re cut off’.”
Jeffrey ended up borrowing money from friends to pay rent for the next six months. But Kathryn is grateful for her father’s “tough love”. She believes it has strongly contributed to her own sense of financial responsibility. While her parents paid her rent and tuition, with the help of an academic scholarship during her four years of undergraduate studies, she was in charge of everything else. “I paid for food, I paid for gas, I paid for activities, I paid for my sorority,” she said.
Kathryn has always had a job since the age of 16. Being aware of how much things actually cost has helped her keep her budget balanced now that she is on her own. But not having that awareness is a huge problem for many college students. “If you’ve always had everything given to you, you wouldn’t think about [cost of things] because it wouldn’t be an issue,” she said.
A majority of Kathryn’s student acquaintances don’t know the basics of personal finances. “You talk to people our age, they’re 18 and they have $12,000 in credit card debt or they don’t know how to pay bills or how to do their taxes,” she said.
Kathryn believes a financial management class in high school should be mandatory. “If your parents don’t teach you, where are you supposed to learn?” she asks.
Catie Robbins, a senior screenwriting major at Chapman, agrees. “Your parents figure you’re going to learn along the way. But then you always feel so much guilt and disappointment when you’re not being responsible with your money. It’d be nice if there was more guidance available.”
Robbins has taken out student loans and receives financial aid, which helps her parents pay for her tuition. But they also take care of her rent, food, and other necessities.
“Basically I don’t have to pay for anything. But it’s scary because they only send me enough money for my food and lodging, so I can’t buy anything else,” she said. “If you want to do fun, random stuff or if you go overboard on your food expenditures, you can be very poor. It’s fine – it’s just kind of sad to be dependent on my parents.”
Robbins looks forward to graduating and getting a job. But right now her financial aid package limits the amount of money she can make from employment to $2,000 a year, which she said she can easily earn during the summer. “As soon as I make that much, I have to quit,” she said. She points out that, counter-intuitive as it is, students are given financial aid because they don’t have enough money, but then are stopped from earning more because of the aid they receive.
There is also a certain irony in being given dreams and goals during college, and then being unable to fulfill them because of the financial burden of college.
“Originally, I had all these ideas for traveling,” said Robbins, who has studied abroad. “But you definitely can’t just take off after school and be youthful and pursue all these silly things. You have to be responsible. I am kind of excited to finally be free and living on my own, and not having to ask my parents for money,” she added.
While financial aid is limiting for some students, and asking your parents for money is never easy, it is definitely a preferable alternative to being entirely dependent on student loans. That’s the situation in which junior Dave Casey finds himself.
Without the minimum required 2.0 GPA, Casey was not eligible for federal student aid this semester. Taking out loans was his only option for staying in college. Currently, he owes about $60,000 with two more years of school to go. He is paying a monthly $187 in interest alone.
“I could have gone to the University of Rhode Island for $6,000 a year,” said Casey, a native of Warwick, R.I. “But I didn’t want to. I was willing to pay because I wanted to go off, I wanted to experience something else, I wanted to be surrounded by a different environment, different people. And I think that’s how you really learn.”
Casey’s father helps him out with rent, and he works over 20 hours a week at a local restaurant. “What stresses me out is that my mother is on food stamps, and I have no money to give her,” said Casey, whose parents are divorced. “I can’t [help], because I’m in a hole myself. Do I send hundreds of dollars a month back to my mom, or do I pay off these loans and then turn to help her? Either way there’s not enough money to go around.” Like Kathryn Rogers and Robbins, Casey’s only hope is to get a steady job after he’s graduated and start paying off his mountainous debt.
“The only reason why I’m not freaking out hardcore about this is because I can’t comprehend it. Set $60,000 in front of me; I’d like to see it. It’s so abstract to me,” he said. “These loan agencies definitely benefit from our naiveté.”
Donald Booth, a professor of economics at Chapman and board member of Consumer Credit Counseling Service, thinks that technology is a major contributor to the lack of financial knowledge.
“The traditional way was the bill came to your house, you wrote a check, licked a stamp and mailed it back. Now you have automatic pay, it withdraws it from your account,” he said. “[People] don’t even know what they have in their checking account.”
The transition to so much financial activity online has been difficult for generations both young and old. “Don’t think it’s just students who don’t know how to manage money – it’s almost everybody,” he said.
Older people are naturally resistant to new technology because they like doing things the way they’re used to, according to Booth. On the other hand, there was no one to teach students to use the Internet as a financial tool.
So we’re basically in the banks’ pockets now, because people aren’t keeping track of the money they’re spending, how much they have, how much they owe. "And everything seems free. You almost never get turned down anytime you want to buy something. Until it catches up with you.”
Rachel Yeung is a senior at Chapman University in Orange County, California.
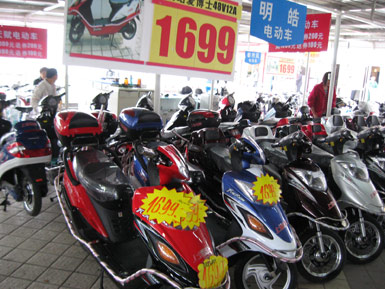
The Wall Street Journal recently carried an article entitled “E-Yikes: Electric Bikes Terrorize the Streets of China.” The article describes difficulties arising from the fact that nearly 120 million electric (battery) bicycles (E-Bikes) are now in operation in China, as people have abandoned mechanical bicycles and highly-polluting petrol motorbikes.
However, to the millions of owners, China’s E-Bikes are a boon, not a bane. E-Bikes are best understood in terms of human aspiration (just like cars in America or Western Europe). People generally seek to improve their lifestyles. Research at the University of Paris, the University of California, the University of North Carolina and elsewhere has clearly demonstrated a strong relationship between higher incomes and higher rates of economic growth where people have greater personal mobility. This is what the E-Bike provides.
In the large urban areas of the 21st century, even the dense Chinese urban areas, travel is highly dispersed. The efficient operation of the urban area requires an ability to travel from any point in the urban area to any other point in a short amount of time. As effective as public transport can be for trips within the dense (but generally small) urban core or to the urban core from suburban areas, a large share of trips simply cannot be feasibly made any other way than by personal mobility. This includes walking, for very short trips and bicycles for somewhat longer trips. But, it also includes substantial and increasing travel by faster modes of transport, particularly cars and two-wheeled vehicles. E-Bikes have greatly improved mobility. At the same time, the E-Bike has enormously reduced both the air pollution and carbon footprint of two-wheeled personal mobility.
This is not to discount the traffic and other difficulties. However, the Chinese, like their western counterparts, will continue to seek better lives and that means greater personal mobility. It means that E-Bike usage will continue to grow and that car usage will also continue to grow, as incomes rise. While that will make traffic congestion even worse, the spectacular automobile fuel efficiency improvements ahead will allow massive expansion of personal mobility, while moving in the right direction with respect to the carbon footprint. In the final analysis, the Chinese (and the Indians, Indonesians, etc.) would like to live as well as we do in the United States and Western Europe. And why not?
Photograph: E-Bike display at a Suzhou (Jiangsu) hypermarket.
While California's much publicized budget battles have made the dire financial straights faced in Sacramento a topic of regular media conversation, other states are also experiencing major fiscal woes. According to experts interviewed by Crain's Chicago Business, Illinois currently finds itself in a state of de facto bankruptcy, with the state's ledgers appearing "to meet classic definitions of insolvency: Its liabilities far exceed its assets, and it's not generating enough cash to pay its bills."
According to Crain's, "While California has an even bigger budget hole to fill, Illinois ranks dead last among the states in terms of negative net worth compared with total expenditures." The state had a record $5.1 Billion in bills past due at year's end, has failed to pay some vendors for months, and has seen the average time to pay a bill double to nearly 92 days. The state also faces rapidly mounting pension obligations, and has seen it's ability to borrow restricted by its worsening credit rating. Facing piles of liabilities, and recession reduced receipts, the state is currently "living hand to mouth, paying bills as revenues come in each day, building up cash when special payments are coming due. Cash on hand varies from day to day, sometimes dipping below $1 million".
A business or municipality facing such financial challenges might be tempted (or forced) to seek the shelter of bankruptcy protection in order to place it's books in order. States, however, do not have recourse to that option under existing federal law. As a result "rather than having a court restructure its finances as in a bankruptcy filing, a state [has]to reorganize its spending and debt on its own." Lawmakers in Springfield, faced with a situation that is bankruptcy in all but name, will have to make difficult decisions regarding future taxes and services.
I was pleased to have the opportunity to have an op-ed produced on transportation in the Atlanta Journal-Constitution on January 17. The op-ed, entitled “Arterial system needed” argued that the most important thing the Atlanta metropolitan area could do to reduce traffic congestion would be to develop a decent arterial street system, something that, unbelievably, does not exist today. Regrettably, the permitted length of the op-ed did not permit much elaboration of the point, or mention of other important issues.
In metropolitan areas with effective arterial street systems (such as Los Angeles), there is usually a surface alternative to a grid-locked freeway. A skilled driver can use these alternate routes and avoid much of the frustration of congestion. This may or may not improve travel times, but it is certainly better for the psyche. In Atlanta, there are few alternatives to the freeways and even the freeway system itself is very sparse.
The principal elaboration for which I wish additional space had been available had to do with the role of transit. Many Atlanta officials are of the view that transit is the solution to traffic congestion. Many of them join pilgrimages to Portland (Oregon), where planners are only too happy to reinforce this view, with their doctrine to the effect that transit has transformed their urban area. The reality is that, after nearly 25 years of major transit improvements, transit’s market share in the Portland area is about the same as it was before.
There are proposals to expand the MARTA transit system and tax from the core counties of Fulton and DeKalb to suburban counties. It is hard to imagine a more counterproductive policy approach. This would shower the overly-costly MARTA system with a stream of revenue with which its out of control costs per mile could escalate. The additional cost to taxpayers and riders would be far in excess of any potential benefits. MARTA’s principal problem is not lack of funding; it is rather insufficient cost control.
The reality is that to reduce traffic congestion, transit would need to attract a large share of urban trips. In fact, however, whether in Paris, Portland or Atlanta, the transit system that could compete for most metropolitan trips has not yet been conceived of, much less developed or even proposed. Because of the necessity to travel from every point in an urban area to every other point, this is simply impossible. The vast majority of travel demand in all major urban areas of the United States and Western Europe is for personal mobility – automobiles – simply because there is no choice in their modern, affluent economies.
Taking on the Portland mystique is not easy – and likely I'll find out again with my most recent piece: Picture-perfect Portland?
But I'd also like to take a Midwest perspective that shows some surprising things. Let's compare Portland to a similarly sized and less acclaimed Midwest city, Indianapolis. You can think of Portland as being in “first place” from a policy perspective by popular acclaim. It has an urban growth boundary, extensive transit, excellent urban density, a strong biking culture, a strong culture of civic engagement, the most microbreweries per capita, and on down the line. It is a place people want to live in so badly that they will move there with no job in hand and would be one of the cities that comes to mind among similar sized metros as a talent hub.
If Portland is first, then you’d have to characterize Indianapolis as “worst”. Indianapolis is surrounded by expanding suburbia with very pro-sprawl policies on all four sides. It is one of the least dense cities in America. It has no rail transit and only the 99th largest bus system, along with one of the lowest transit market shares in the country. It is currently in the middle of a multi-billion program to widen about 60 miles of freeway. It just recently put in its very first bike lanes and scores near the bottom in green measures of sustainability. Its brand image also is hardly the best. You don’t hear too many people around the country going, “Man, I’ve gotta get me to Indianapolis.”
But let’s look at how these cities compare on various quantitative measures of urban performance.
Portland
Indianapolis
Population Growth (2000-2008)
14.5%
12.5%
Domestic In-Migration (2000-2008)
5.4%
4.2%
International In-Migration (2000-2008)
3.7%
1.4%
Job Growth 2001-2009 (QCEW)
10,300 (1.1%)
17,100 (2.1%)
Job Growth 2001-2009 (CES)
23,800 (2.4%)
31,000 (3.6%)
Unemployment Rate (Nov 2009)
10.8%
8.2%
Per Capita GMP (2008)
47,811
46,450
Per Capital GMP Growth (2001-2008)
22.4%
1.7%
Median Household Income (ACS 2008)
$58,758
$53,671
Median Monthly Housing Cost (ACS 2008)
$1,522
$1,125
College Degree Attainment (ACS 2008)
33.3%
31.8%
Travel Time Index (Texas A&M)
1.28
1.21
Now in most of these Portland does beat Indy, but not by a lot. In job growth and unemployment – two big factors in today's economy – Indy actually does better. Portland's higher incomes are offset by higher housing costs. There are only two stats – international migration and GMP per capita growth – where Portland has a big lead.
Given the wide difference in their policies, it is striking to see these cities so close. By rights, it should be total world domination by Portland – but it isn’t.
Now obviously these aren’t the only statistics to measure a city by. Portland residents would no doubt tout their many livability advantages. Yet at some point isn’t livability supposed to translate into superior demographic and economic performance? Isn’t it supposed to make a city attractive to the talent pool needed to thrive in the 21st century? And isn’t that talent supposed to power the economy? I was particularly struck by how close the cities were on college degree attainment. While I called Portland a talent hub, perhaps I spoke too soon. Contrast with Boston, which has 41.9% of its over 25 population with a bachelors degree or better.
It may be that policy changes act with a lag. But Portland has been at this a long time. The UGB dates to 1973 and the light rail system started construction in the early 80s, for example. Perhaps other factors play a bigger role than many imagine. Land use and transportation policies might provide benefits to cities, but they do not, by themselves, create an economic dynamo.
Oregon’s voters will soon give their judgment on Measures 66 and 67, measures that will raise income and corporate taxes in the recession-ravaged state – with unemployment at 11.1 percent, the eighth highest in the nation. Besides leaving the state with the highest marginal rate in the country, tied with Hawaii, more insidiously measure 67 will impose a minimum tax based on sales, not profits, implying an infinite marginal tax rate for low-profit companies.
This is not good news for businesses and citizens of Oregon. In a report titled Tax Policy and the Oregon Economy: The Effects of Measures 66 and 67, Two Cascade Policy Institute economists, Eric Fruits and Randall Pozdena, thoroughly review the literature on the impacts of tax increases on jobs and domestic migration, and they rigorously analyze the measures’ impact on Oregon jobs and migration.
They estimate the new measures through 2018, will cost Oregon employment losses of “approximately 47,000.”
Finally, Fruits and Pozdena examine the impacts of measures 66 and 67 on migration. They find that adoption of measures 66 and 67 will result in the loss of approximately 80,000 Oregon tax filers with a loss of $5.6 billion in adjusted gross income.
These results have to be taken as the minimum impacts. Fruits and Pozdena are careful researchers. They do nothing that is not completely defensible. Consequently, because of statistical issues, some of the potential impacts, particularly those of measure 67’s minimum tax based on sales are almost surely under measured.
Clearly Oregon , where many residents look down on the increasingly bedraggled Golden State seems anxious to follow California’s decline trajectory. We all know how that story ends: high unemployment, domestic out-migration, declining jobs, declining opportunity, and a vanishing middleclass.
I am not alone in seeing the warning signs.
The PEW Center on the States issued a report in November 2009 titled Beyond California: States in Fiscal Peril. PEW created an index using foreclosure rates, job losses, state revenues, budget gaps supermajority requirements, and money-management practices. The index resulted in values ranging from 6, Wyoming, to 30 California. Higher values are bad here, and the closer to California’s 30, the more a state is at risk of California-style fiscal problems. Oregon, with a value of 26 is listed as one of nine states that the PEW researchers consider at high risk.
Then there’s Small Business & Entrepreneurship Council’s recently released Small Business Survival Index. They use a much larger set of variables to create their index of public policy climates for entrepreneurship, a total of 39 indicators covering tax policy, regulation, crime rates, costs, and more. This index results in values ranging from 25.7 for South Dakota to 84 for the District of Columbia. As with the previous index, high numbers are bad. California, with a score of 77.7 is the second worst state, behind only New Jersey. Oregon’s score is 65.2, the 38th among states, and dangerously close to California’s score.
Infinite Suburbia is the culmination of the MIT Norman B. Leventhal Center for Advanced Urbanism's yearlong study of the future of suburban development. Find out more.
Authored by Aaron Renn, The Urban State of Mind: Meditations on the City is the first Urbanophile e-book, featuring provocative essays on the key issues facing our cities, including innovation, talent attraction and brain drain, global soft power, sustainability, economic development, and localism.

 This is not to discount the traffic and other difficulties. However, the Chinese, like their western counterparts, will continue to seek better lives and that means greater personal mobility. It means that E-Bike usage will continue to grow and that car usage will also continue to grow, as incomes rise. While that will make traffic congestion even worse, the spectacular automobile fuel efficiency improvements ahead will allow massive expansion of personal mobility, while moving in the right direction with respect to the carbon footprint. In the final analysis, the Chinese (and the Indians, Indonesians, etc.) would like to live as well as we do in the United States and Western Europe. And why not?


