It’s been a long time since the Democrats were considered “the party of the people” and the GOP the party of the fat cats. This year Joe Biden and even more so his running mate, Kamala Harris, are raising record sums from the corporate elite, notably the tech giants and their Wall Street allies. These wealthy donors dominate the party, own much of the media, and can manipulate the social-media platforms where a growing proportion of Americans get their news.
Meanwhile, the Republicans find themselves largely castigated in the press and overwhelmed by a torrent of oligarchic wealth at the Senate and local levels. This wealthy oligarchy is not just liberal; many members also support a thorough remaking of our country. Some, like former Twitter CEO Dick Costolo, are so committed to progressivism that, as he said recently, those who don’t get with the program should “face a firing squad.” Currently led by CEO Jack Dorsey, Twitter has gone so far as to block The New York Post’s account after it reported on the unsavory foreign business dealings of Biden’s son Hunter.
If these Democrats win both houses of Congress as well as the White House, things could get far worse for the already beleaguered middle class, which has been rocked by the pandemic, with an estimated 100,000 small firms going out of business. Particularly hard-hit by the recent urban unrest are inner city and minority businesses.
On today's episode of Feudal Future hosts Joel Kotkin and Marshall Toplansky are joined by guest Morley Winograd. Morley is a Senior Fellow at the University of Southern California’s Annenberg School’s Center on Communication Leadership and Policy, author, and fellow at democratic think tank NDN. Morley also served as the chairman of the Michigan Democratic Party, and Senior Policy Advisor to Vice President Al Gore.
Their conversation begins with Joel asking Morley what battles democratic leadership may face should Joe Biden win the 2020 election. Morley quips that should democrats win the upcoming election, they will go into the White House with a very broad coalition, and thus spend a lot of time fighting amongst themselves. Michigan has had an interesting and diverse electorate over the years, and Morley spends some time explaining the layout, and how President Trump took a foothold in some regions.
What we’re witnessing with this election, Marshall explains, is the handover to the next generation of leaders in our house and senate. He asks Morley what that change will look like. Morley stresses that millennials are concerned that nothing in government is working anymore. They’re distrustful of markets and companies, and don’t look to the federal government, but rather you’ll find them working on local change. They’re the heart of grassroots movements across the country, and in this election, no one will be able to say they don’t vote as they are lining up in droves to cast their ballots. Once the votes are cast, should Joe Biden win, Marshall asks Morley what happens to the far-right wing of the Republican Party. Morley believes that the uglier elements of Trumpism will go back into the shadows, but it will not go away.
As the episode ends, they discuss the upcoming generation, Gen Z, or as Morley calls them, plurals, and why he thinks they are the great hope for America.
On today's episode of Feudal Future hosts Joel Kotkin and Marshall Toplansky interview John Russo, co-author of Steel Town USA and a visiting scholar at Georgetown University. John has spent most of his academic career at Youngstown State University in Ohio, and he has spent much time cataloguing the plight of the middle class and working class in the US.
As the conversation begins, John talks about the political situation in Ohio. While Donald Trump polled well in Ohio in 2016, with the 2020 presidential election right around the corner, John notes that Trump is now in trouble in Ohio. He explains from his observations in Youngstown how this change occurred, specifically citing the development of disillusionment with Trump. John also comments on demographics in Ohio, an article he wrote on Trump’s prospects in the state, Operation Grant, schism within the Republican party, and party polarization.
Next, focus shifts to issues surrounding the election itself. John does not offer a concrete guess as to who will win, but comments that the election is not so much about Trump and Biden as it is about the American people and their future. The election marks a significant generational shift as a new wave of young voters steps up, and John explains how this generation differs from generations that preceded it. He shares about potential conflict in the Democratic party, the idea of a “political parabola,” and realities of fear among voters.
Finally, the conversation turns to thoughts on the future, focusing first on the top three policy initiatives of the prospective Biden administration before turning to the future of capitalism, which John imagines will look more like the system established in China. As the episode moves toward a close, Joel, Marshall, and John talk about issues in the technology sphere, the last chance for the democratic party, labor reform, and more!
There have been reports of rising Covid-19 infection rates in rural areas and even “surges,” such as here and here.
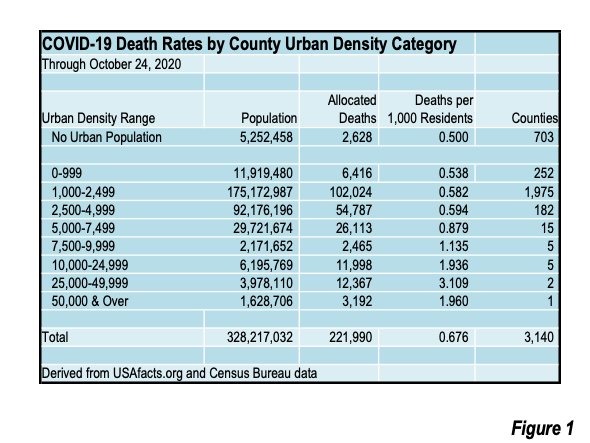
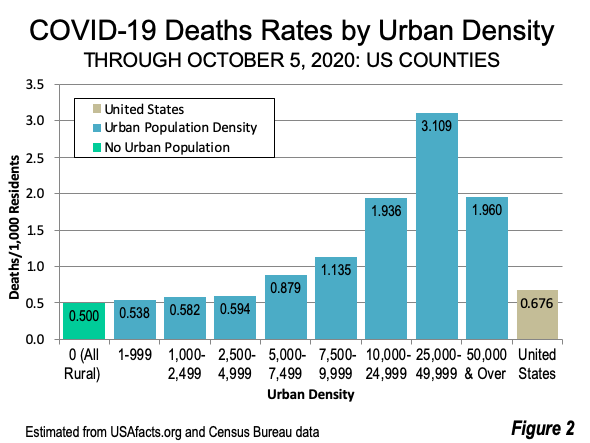
Many of these reports fail to note the most important statistic of all with respect to rural areas --- that, even with the recent increases and surges, rural Covid death rates remain below the national average. There are 703 counties in the United States that are completely rural (based on 2010 Census Bureau data), with no urban population. As of last Friday (October 24), the Covid death rate in these counties was 0.500 per 100,000 population. This is about 30% below the national rate of 0.676 per 100,000 (Figure 1 and 2). This analysis is described in “Perspective: US Covid-19 Deaths and Urban Population Density.”
All of the other counties in the nation have areas defined by the Census Bureau as urban, ranging from little under one percent to 100 percent.
Urban density is important. Covid infections and deaths are associated with higher urban densities. This is not because population density is a problem in itself. It is rather that in high urban densities it is more difficulty to avoid higher exposure densities, because the intensity and duration of risky contacts is likely to be greater. These areas are often characterized by worrying overcrowding from insufficiently ventilated enclosed spaces, such as elevators, transit, offices and public buildings. Social distancing alone is not enough. According to The New York Times: Small, crowded, enclosed spaces are petri dishes for the coronavirus. An additional problem in higher density residential areas is overcrowded apartments, often necessary because lower income households often cannot afford detached houses with yards in which kids can play. There is an important poverty connection.
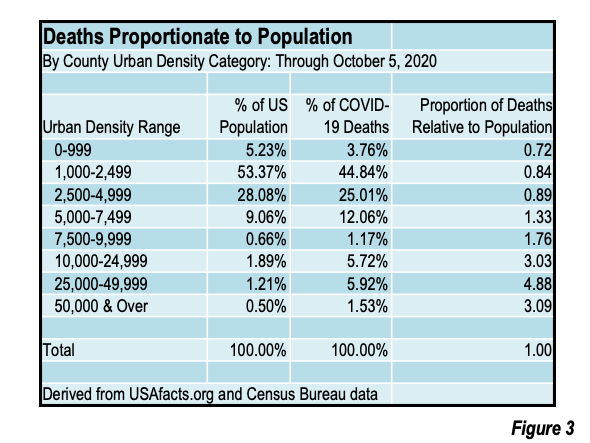
The newest data continues to show that Covid fatality rates are much higher in counties with the highest urban densities. Counties with over 10,000 persons per square mile have from just under four to over six times the rural county death rate. The rural counties account for 28% fewer deaths proportionally than their population.
Counties with urban densities of less than 5,000 persons per square mile have a smaller proportion of Covid deaths than their population share. Above 5,000 persons per square mile, Covid deaths are proportionately higher than population shares (Figure 3).
Similar relationships are evident elsewhere, such as in the United Kingdom and Japan.
At the same time, however, the higher density counties have made substantial progress in controlling COVID infections and deaths. This is very good news. At least in part, this has been made possible by lockdown strategies that have led to huge decreases in transit ridership, high rise downtowns with largely empty offices and limits on elevator occupancy. The real question will be how long it will take for to return to normal, especially in the densest areas, which have been the hardest by lifestyle interruptions (see: Escape from New York).
COVID-19 presents great challenges to Northwest Arkansas (NWA) as it does to every community, but the region is in strong standing to weather this global pandemic.
Ensuring it does so requires leveraging – and enhancing – the region’s economic, social and demographic strengths while addressing its weaknesses.
To generate such an economic recovery strategy, Heartland Forward (HF) has undertaken an extensive and detailed analysis of the NWA region’s strengths, challenges and opportunities. Our team has arrayed and assessed comprehensive data on its economy and industries, its small businesses and startup ecosystem, talent base, changing demographic composition and quality of place that stems from its arts, culture and recreation efforts and initiatives to develop a robust strategy for post-COVID-19 recovery.
We supplemented these details with interviews and focus groups with real people living in NWA and representing each of these core sectors and communities to provide in-depth background into what is happening on the ground in NWA.
Before the crisis hit, our assessment indicates that the region was performing well . . . excelling in population growth, job and wage growth and other vital metrics.
NWA ranked:
fourth in population growth of the more than 100 U.S. metro areas with more than 500,000 people since 1990,
third in job growth, and
second in annual average pay gains among medium-size metropolitan areas (i.e., populations of 500,000 to 999,999) between 2013 and 2018.
Infinite Suburbia is the culmination of the MIT Norman B. Leventhal Center for Advanced Urbanism's yearlong study of the future of suburban development. Find out more.
Books
Authored by Aaron Renn, The Urban State of Mind: Meditations on the City is the first Urbanophile e-book, featuring provocative essays on the key issues facing our cities, including innovation, talent attraction and brain drain, global soft power, sustainability, economic development, and localism.