Alain Bertaud of the Stern School of Business at New York University and former principal planner of the World Bank introduces the 10th Annual Demographia International Housing Affordability Survey by urging planners to abandon:
"...abstract objectives and to focus their efforts on two measurable outcomes that have always mattered since the growth of large cities during the 19th century’s industrial revolution: workers’ spatial mobility and housing affordability".
This year's edition has been expanded to nine geographies, including Australia, Canada, Hong Kong, Ireland, Japan, New Zealand, Singapore, the United Kingdom, and the United States. A total of 85 major metropolitan areas (of over 1,000,000 population) are covered, including five of the six largest metropolitan areas in the high income world (Tokyo-Yokohama, New York, Osaka-Kobe-Kyoto, London, and Los Angeles). Overall, 360 metropolitan markets are included.
View the map with housing data for all markets created by the New Zealand Herald.
The Affordability Standard
The Demographia International Housing Affordability Survey uses a price-to-income ratio called the "median multiple," calculated by dividing the median house price by the median household income. Following World War II, virtually all metropolitan areas in Australia, Canada, Ireland, New Zealand, the United Kingdom, and the United States had median multiples of 3.0 or below. However, as urban containment policies have been implemented in some metropolitan areas, house prices have escalated well above the increase in household incomes. This is exactly the effect that economics predicts to occur where the supply of a good or service is rationed, all things being equal.
Even a decade ago, there was considerable evidence of the rapidly deteriorating housing affordability in markets with urban containment policy. Yet, governments implementing these policies were largely ignoring not only the trends, but also any reference to the extent of the losses in historic context. Co-author Hugh Pavletich of Performance Urban Planning and I established the Demographia International Housing Affordability Survey to draw attention to this policy driven attack on the standard of living.
The Demographia Survey rates housing affordability as follows:
|
Demographia Housing Affordability Rating Categories |
|
|
Rating |
Median Multiple |
|
Severely Unaffordable |
5.1 & Over |
|
Seriously Unaffordable |
4.1 to 5.0 |
|
Moderately Unaffordable |
3.1 to 4.0 |
|
Affordable |
3.0 & Under |
Affordability in the 9 Geographies
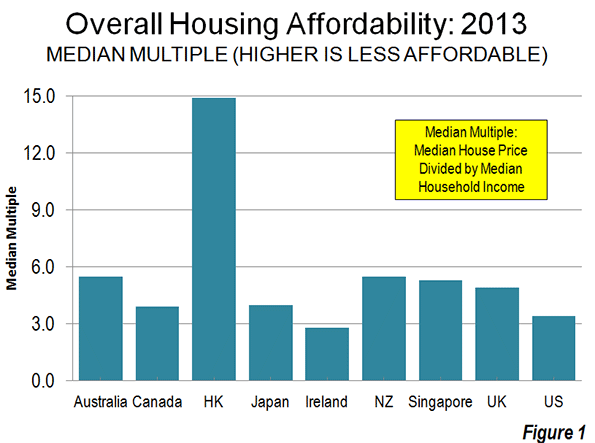
Among the nine geographies and all 360 markets, Ireland emerges has the most affordable, with a median market multiple of 2.8. The United States follows at 3.4, and Canada at 3.9. Japan’s median market multiple is 4.0, while the United Kingdom is at 4.9 and Singapore at 5.1 The other geographies are all well into the severely unaffordable category, including Australia and New Zealand, at 5.5, and far worse Hong Kong, at 14.9 (Figure 1).

Costly Hong Kong & Vancouver, Affordable Pittsburgh and Atlanta
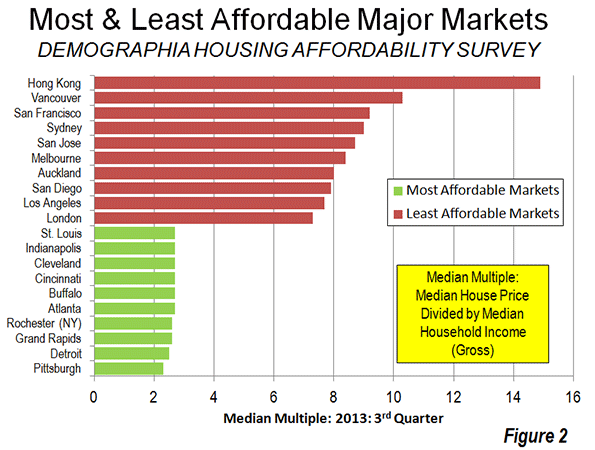
For the fourth year in a row, Hong Kong is the least affordable major metropolitan area, with a median multiple of 14.9, three times its early 2000s ratio. Vancouver is again the second most unaffordable major market, with a median multiple of 10.3, three times its pre-urban containment level. Housing affordability in coastal California is well on the way to the stress of the 2000s. San Francisco ranks third most unaffordable at 9.2 and nearby San Jose is at 8.7, with San Diego (7.9) and Los Angeles (7.7) following closely. Sydney, at 9.0, ranks fourth with Melbourne at 8.4 and Auckland at 8.0.All of these metropolitan areas have had serious deterioration of housing affordability since adopting urban containment policy.
All of the affordable major metropolitan areas are all in the United States. Pittsburgh is the most affordable, at 2.3. There are 13 additional major affordable housing markets, which include growing and over-5 million Atlanta as well as Indianapolis and Columbus, with their strong economies (Figure 2).

Japan
Notably, Japan's two largest metropolitan areas, Tokyo-Yokohama and Osaka-Kobe-Kyoto have avoided the severely unaffordable territory occupied by the other three megacities (New York, Los Angeles, and London). Osaka-Kobe-Kyoto has the best housing affordability of any megacity, at 3.5 (moderately unaffordable) and Tokyo-Yokohama is at 4.4 (seriously unaffordable).
House Size
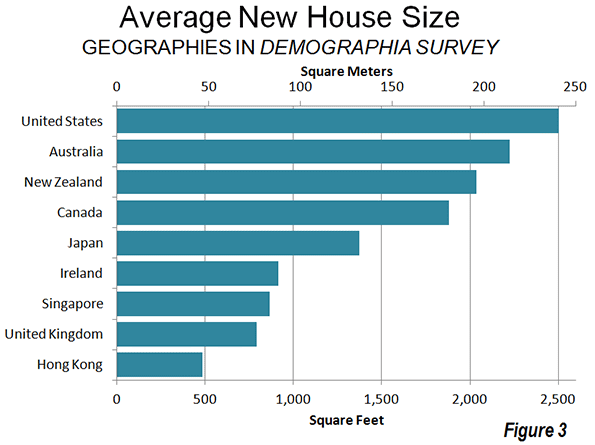
This year's Demographia Survey also provides information on average new house size in the nine geographies (Figure 3). The largest houses are in the United States, which is second only to Ireland in affordability. The smallest houses are in Hong Kong, which also has the least affordable housing. In living space those who pay the most get the least, while those who pay the least get the most.

The Imperative for Reform
Housing is the largest element of household budgets, and its cost varies the most between metropolitan areas. Where households pay more than necessary for housing, they have less dicsretionary income and lower standards of living and there is more poverty. This is a natural consequence of planning policies that place the urban form above the well-being of people. One of the principal justifications is environmental, but the gains from urban containment policy are scant and exorbitantly expensive.
Virtually all of the geographies covered in the Demographia Survey are facing more uncertain economic futures than in the past. As is always the case in such situations, lower income households tend to be at greatest risk, while younger households have much less chance of living as well as their parents (except those fortunate enough to inherit their wealth or housing).
There is no more imperative domestic policy imperative than improving the standard of living and minimizing poverty. Planning must facilitate that, not get in the way. Bertaud is hopeful:
"But if planners abandoned abstracts and unmeasurable objectives like smart growth, liveability and sustainability to focus on what really matters – mobility and affordability – we could see a rapidly improving situation in many cities. I am not implying that planners should not be concerned with urban environmental issues. To the contrary, those issues are extremely important, but they should be considered a constraint to be solved not an end in itself."
Download the full report (pdf): 10th Annual Demographia International Housing Affordability Survey
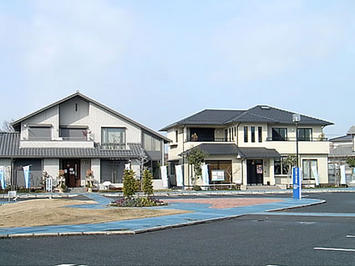
Photo: Suburban Tokyo (by author)


The annual household income for Hong Kong is not as high!
The annual household income for Hong Kong is not as high!
Please look at this web page:
http://www.gov.hk/en/about/abouthk/factsheets/docs/population.pdf
Whatever
"Rockford and Utica in the United States are ranked as the world's most affordable "
Who would ever want to live in either one of these places?
Dave Barnes
+1.303.744.9024
Busted cities WITHOUT obstructive planning, versus those WITH
How less desirable are Rockford and Utica than Liverpool and Newcastle? Because the property values in the latter 2, in spite of major population loss over the last 3 decades, are prevented from ever falling to recovery-assisting levels by their incredibly obstructive town planning systems.