Americans continue to favor large houses on large lots. The vast majority of new occupied housing in the major metropolitan areas of the United States was detached between 2000 and 2010 and was located in geographical sectors associated with larger lot sizes. Moreover, houses became bigger, as the median number of rooms increased (both detached and multi-family), and the median new detached house size increased.
These conclusions are based on an analysis of small area data for major metropolitan areas using the City Sector Model. City Sector Model analysis avoids the exaggeration of urban core data that necessarily occurs from reliance on the municipal boundaries of core cities (which are themselves nearly 60 percent suburban or exurban, ranging from as little as three percent to virtually 100 percent). It also avoids the use of the newer "principal cities" designation of larger employment centers within metropolitan areas, nearly all of which are suburbs, but are inappropriately joined with core municipalities in some analyses. The City Sector Model" small area analysis method is described in greater detail in the Note below.
Increase in Detached Housing
America's preference for detached housing was evident across the spectrum of functional city sectors between 2000 and 2010. Overall, there was a 14% increase in detached housing in the major metropolitan areas. Among the major metropolitan areas (over 1 million population), the number of occupied detached houses rose the most (35%) in the later or generally outer suburbs and exurban areas (24%). Detached houses increased 2.8 million in the later suburbs and 2.5 million in the exurban areas. A smaller 50,000 increase was registered in the earlier or generally inner suburban areas. Most surprisingly, there was also a small increase (20,000) in the number of detached houses in the functional urban cores (Figure 1).

Smaller Increase in Multi-Family Housing
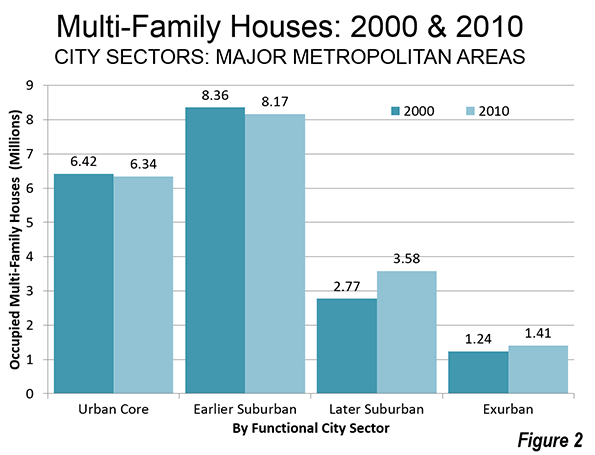
The increase in detached housing dwarfed that of new multi-family housing (owned and rented apartments). The increase in detached housing in the major metropolitan areas was six times that of multi-family housing. Overall, there was a four percent increase in multi-family housing in the major metropolitan areas, less than one-third the increase in detached housing. There were slight decreases in the number of multi-family houses in both the urban cores and the earlier (generally inner) suburbs. At the same time, there has been a healthy increases in the number of multi-family houses in the later suburbs and exurbs, where the growth rates exceeded the increase in major metropolitan population (11%). In the later suburbs, multi-family housing increased 29% and in the exurbs the increase was 14% (Figure 2).

Larger Houses, Larger Lots
Yet overall, houses were getting bigger. The median number of rooms per house rose from 5.3 in 2000 to 5.6 in 2010. Increases in median rooms were registered in each of the city sectors (Figure 3). Nationally, the median size of new detached housing edged up five percent between 2000 and 2010. (By 2013, median new house size had increased another 17 percent to a record 2,384 square feet).

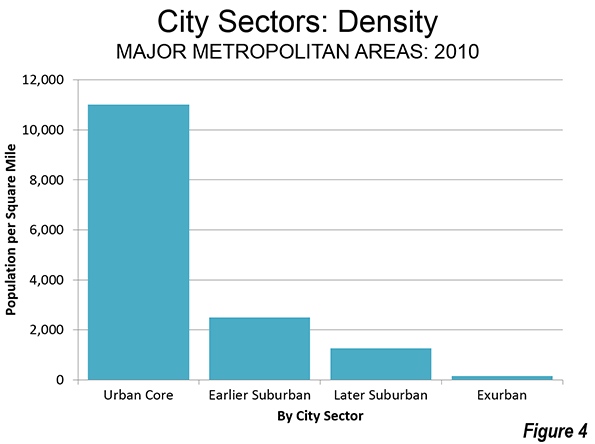
Lots also were getting bigger. Nearly all of the population growth (99 %) was in the later suburbs and exurbs between 2000 and 2010, where population densities are much lower and lots are larger than in the earlier suburbs and the urban core (Figure 4).

The preponderance of urban planning theory over the past decade has been based on the notion that people would increasingly seek houses on smaller lots. For example, Arthur C. Nelson of the University of Utah predicted that the demand for housing on conventional-sized lots (which Professor Nelson defines as more than 1/8 acre, which is smaller than the smallest lot size reported by the Census Bureau) would be only 16% in the major metropolitan areas of California by 2010, relying in part on stated preference survey data. In fact the revealed preferences --- in other words what people actually did --- was four times the predicted demand (64%) in the conventional-lot-dominated later suburbs and exurbs of California's largest metropolitan areas between 2000 and 2010. This is despite California's regulatory and legal bias against detached housing on conventional lots (See: California's War Against the Suburbs). Outside California, later suburban and exurban detached housing represented 77% of new housing demand over the period.
Planning and Preferences
Urban cores and multi-family housing are favored by urban planning policy. Yet, large functional urban cores (high density and high transit market share, as defined in the City Sector Model, Note below) are few and far between, with only seven exceeding 500,000 population, a modest number equaled or exceeded by approximately 100 metropolitan areas. Overall, the functional urban cores of major metropolitan areas lost more than 100,000 residents between 2000 and 2010, while suburban and exurban areas gained more than 16.5 million. Predictably, the housing forms typical of the later suburbs and exurbs made strong gains. The preferences of planning are not those of people and households.
-------------
Note: The City Sector Model allows a more representative functional analysis of urban core, suburban and exurban areas, by the use of smaller areas, rather than municipal boundaries. The more than 30,000 zip code tabulation areas (ZCTA) of major metropolitan areas and the rest of the nation are categorized by functional characteristics, including urban form, density and travel behavior. There are four functional classifications, the urban core, earlier suburban areas, later suburban areas and exurban areas. The urban cores have higher densities, older housing and substantially greater reliance on transit, similar to the urban cores that preceded the great automobile oriented suburbanization that followed World War II. Exurban areas are beyond the built up urban areas. The suburban areas constitute the balance of the major metropolitan areas. Earlier suburbs include areas with a median house construction date before 1980. Later suburban areas have later median house construction dates.
Urban cores are defined as areas (ZCTAs) that have high population densities (7,500 or more per square mile or 2,900 per square kilometer or more) and high transit, walking and cycling work trip market shares (20 percent or more). Urban cores also include non-exurban sectors with median house construction dates of 1945 or before.
-------------
Wendell Cox is principal of Demographia, an international public policy and demographics firm. He is co-author of the "Demographia International Housing Affordability Survey" and author of "Demographia World Urban Areas" and "War on the Dream: How Anti-Sprawl Policy Threatens the Quality of Life." He was appointed to three terms on the Los Angeles County Transportation Commission, where he served with the leading city and county leadership as the only non-elected member. He was appointed to the Amtrak Reform Council to fill the unexpired term of Governor Christine Todd Whitman and has served as a visiting professor at the Conservatoire National des Arts et Metiers, a national university in Paris.
Photo: Northern Suburbs of Minneapolis-St. Paul (by author)


I loved the graph work that
I loved the graph work that you introduced in the article, it’s quite informative. A picture says thousand words itself. hexder at hubpages