Los Angeles transit ridership has fallen even more than a recent Los Angeles Times front page story indicated, according to Thomas A. Rubin, who served as Chief Financial Officer (auditor/controller) of the Southern California Rapid Transit District (SCRTD) from 1989 until 1993, SCRTD merged with the Los Angeles County Transportation Commission (LACTC) after the first new rail line was opened in the early 1990s (I served as a city of Los Angeles appointee to the board of LACTC).
It is not that the Times misreported the story, but rather that the official data it used does not fully account for important underlying ridership data.
Rubin's analysis, (available here), responds to a commentary by Ethan Elkind who criticized the Los Angeles Times article for providing a misleadingly pessimistic ridership picture. Rubin shows that, in fact, a closer look at the data suggests things are even worse that suggested by the Times.
Rubin provides compelling evidence refuting the Elkind commentary (discussed below), as well as more detailed ridership issues that require deeper analysis. Tom Rubin is among the nation’s most knowledgeable transit advocates) and his commentary provides far more information than is summarized in this article. Rubin's commentary is necessary reading for anyone seriously interested in the history of transit in the new rail era (since 1980).
Passenger Journeys v. Linked Trips
Transit ridership statistics in the United States nearly exclusively rely on the concept of unlinked trips. An unlinked trip occurs every time a passenger enters a transit vehicle. Thus, if a rider takes one bus and then transfers to another bus to complete a trip, this single passenger journey counts as two unlink trips. Or, if a passenger starts the journey on the bus, transfers to a rail line, then transfers to another rail line and finally to a bus, this single passenger journey will count as four unlinked trips. So, when comparing transit ridership in the United States, it is important to keep in mind that unlinked trips, rather than passenger journeys are being counted.
It is worth noting, that in some other countries, officials have found it relatively easy to count passenger journeys. For example, most large European transit systems count passenger journeys and thus do not report the inflated ridership figures that occur as a result of countingtransfers on a single trip.
As Rubin points out, transfer ratios vary significantly between systems. Further, transfer ratios tend to increase as transit agencies open rail systems. As new rail lines are opened, bus routes are often truncated as agencies attempt to force more ridership on to the rail system. This means that the number of transfers increases. Data that Rubin provides indicates that the linked trip to passenger journey ratio on the former SCRTD/MTA transit system has risen from 1.66 linked trips per passenger journey in the early 1990s to 2.25 in the most recent surveys . Rubin also notes that some surveys have shown even higher transfer ratios in recent years. He uses the 2.25 transfer ratio to obtain the most conservative possible estimate of 2015 passenger journeys.
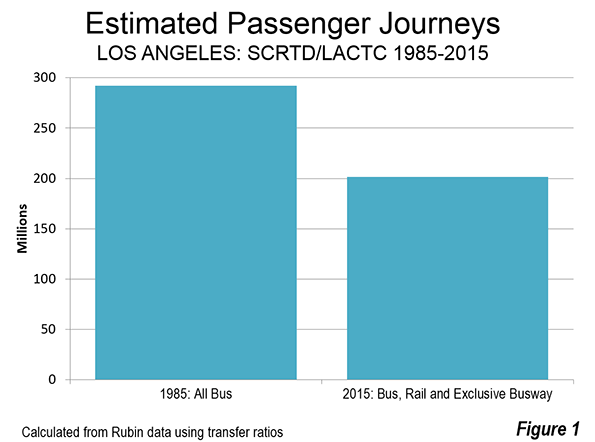
According to the unlinked trips data reported by the Los Angeles Times, transit ridership on the SCRTD/MTA transit system declined nearly 10 percent from 1985 to 2015, despite the addition of billions of dollars worth of new rail lines. Taking Rubin's estimate of passenger journeys based on the change in transfer rate (from 1.66 to 2.25 unlinked trips per passenger journey), the drop would be even greater, at a loss of more than 30 percent. Passenger journeys, using these ratios, would have been approximately 290 million in 1985 and 200 million in 2015 (Figure 1).

Billions for What?
Rubin has provided important research in his analysis of rail construction costs. Over the past 30 years. Rubin estimates that approximately $16.4 billion dollars (2016$) has been spent to build the routes that are already in service (including the Orange Line busway, but not the Silver Line busway, which he does not include) Elkind implies that this is not enough to see a “true return” on investment.
With all the huzzahs about the rail system having made transit “the next great mass-transit city,” and the near universal praise for the rail system among the “powers that be” in Los Angeles, the Times is to be commended for courageously revealing the billions that have been spent while millions have abandoned transit, as SCRTD/MTA have placed a priority on expanding the rail services. Rubin also shows that another $9.0 billion is expected to be spent on new lines that will be opened by 2023.
How Much is a Rail Rider Worth?
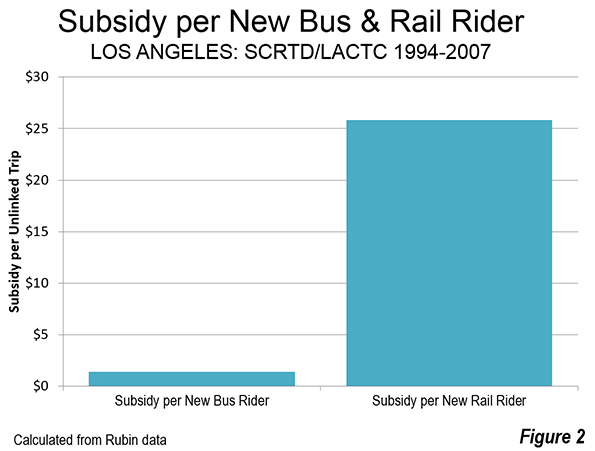
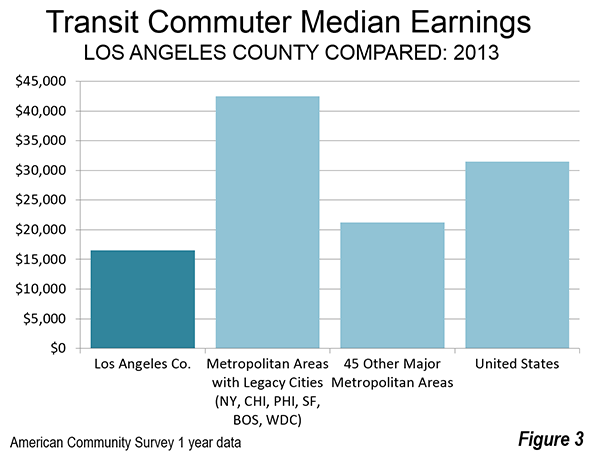
Rubin was a principal actor in a civil rights lawsuit that forced MTA to reduce its rail spending and increase in spending on buses and lower fares after ridership had fallen about 120 million from its 1985 peak. During the period that the court oversaw MTA, was forced to add more bus service and lower bus pass prices. Rubin shows that during the period of rising ridership, from 1994 to 2007, unlinked trips nearly recovered to the 1985 peak. The ridership increase required a subsidy of $1.40 to add each new bus rider and $25.82 for each new rail rider (Figure 2). This suggests that a new rail rider is valued at nearly 20 times that of a new bus rider. This illustrates that it is far less expensive to increase ridership in Los Angeles with lower bus fares than with rail lines. It is also far more helpful to, Los Angeles transit riders, whose median income is well below that of transit riders nationally, and who need better access to jobs for the higher standard of living they seek (Figure 3).


What About the Base Year
Elkind suggests that the Los Angeles Times was unfair in comparing 2015 ridership to the peak year of 1985. Rubin does not accept this argument and for good reason. The principal purpose of the rail system was to increase ridership and any other outcome was, frankly, beyond the pale. The opening of 10 new rail and busway corridors is more than sufficient to have a significant increased ridership, which, as both Rubin and the Times shows, they have not (Note).
As author of the rail funding amendment to Proposition A in 1980 that provided virtually all of the local funding for the rail system for a decade, these results fall far short of expectations. If I had doubted the ability of a large rail system to significantly increase transit ridership, I would not have offered the amendment (the only other similar amendment offered that day had already been rejected).
Further, never in my succeeding five years on LACTC including the two years I served on the Rail Transit Committee did I ever hear another member of the Commission or a member of staff imply that there was any possibility that lower ridership could be the result. Had such a view become dominant, the “plug would probably have been pulled,” and the bus system maintained and improved. If so, transit would be carrying many more people today, while delivering value for taxpayers.
Photograph: John Ferraro Building, which hosted LACTC board meetings during my tenure. Los Angeles City Council President John Ferraro was the first chair of LACTC.
Note: Each downtown oriented corridor counts as one (so that, for example, the Gold Line, which enters downtown from two directions is counted as two). Lines that do not reach downtown are counted as one.
Wendell Cox was appointed to three terms on the Los Angeles County Transportation Commission by Los Angeles Mayor Tom Bradley. The LACTC board consisted of the Mayors of Los Angeles and Long Beach, two smaller city majors, the five county supervisors (county commissioners) and two other appointees of the Mayor of Los Angeles. Mayor Bradley routinely appointed the City Council President to fill one of these two seats as well as a private citizen (Wendell Cox). Wendell Cox chaired the Service Coordination Committee and also served on the Rail Transit and Finance Review Committees.


