The statistical authorities of various nations survey commuting behavior of their citizens in periodic population censuses and related surveys. Most of this data relates to the residential location of workers, but not to the work location. Both sets of data are important for understanding the dynamics of mobility within urban areas. However, in some countries, like Canada and the United States work location is not readily available. As a result, items of analysis such as how people get to work and the density of employment in parts of urban areas can be difficult, if not impossible to obtain. For example, based on the last two censuses, we have produced reports estimating the shares of employment in the downtown areas of major metropolitan areas.
New Zealand has a model program that provides detailed information both on residential location and work location. The work location data is not only important as a model for other statistical authorities, but also reveals trends which the more limited data in other countries suggest. This article will describe the commuting data in the three largest metropolitan areas in New Zealand (Note). The analysis focuses on the 2013 census, which was postponed from 2011 as a result of the disastrous Christchurch earthquakes. As will be shown below, these events had major implications in the commuting data for New Zealand's second largest metropolitan area.
Auckland
Auckland has by far the largest metropolitan area in New Zealand, with approximately 1.6 million residents. As a result of the recent local government consolidation, Auckland has emerged as the only entire metropolitan area in the high income world of more than 1 million population that is administered by a single local government. It will soon be followed by Honolulu, which has a single local government, and which is soon to pass 1 million population.
Auckland houses about one third of New Zealand's population. As a result, Auckland is dominates New Zealand. By comparison, the New York metropolitan area, in its most liberal definition (combined statistical area) represents only seven percent of the US population.
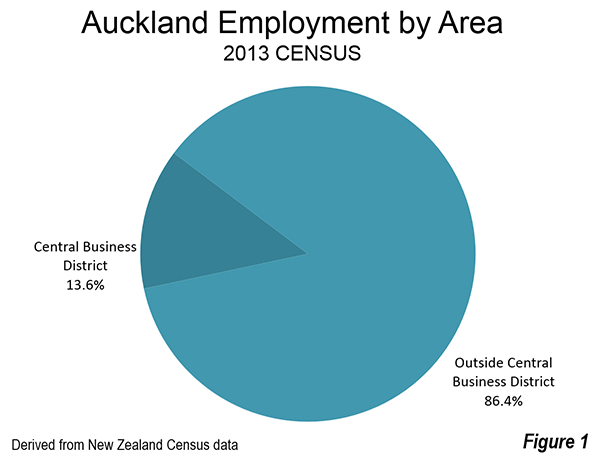
The Statistics New Zealand data indicates that the Auckland central business district (CBD or downtown area) has approximately 13.6 percent of the jobs (Figure 1) in the metropolitan area (the city of Auckland, or the Auckland Regional Council). This is nearly double the US average for major metropolitan areas (over 1 million population), which is 7.0 percent, but well below New York's 22.0 percent. It is about the same as that of Canada's major metropolitan area average, and that of Canada's largest metropolitan area, Toronto. It also duplicates the Sydney CBD share of metropolitan employment.
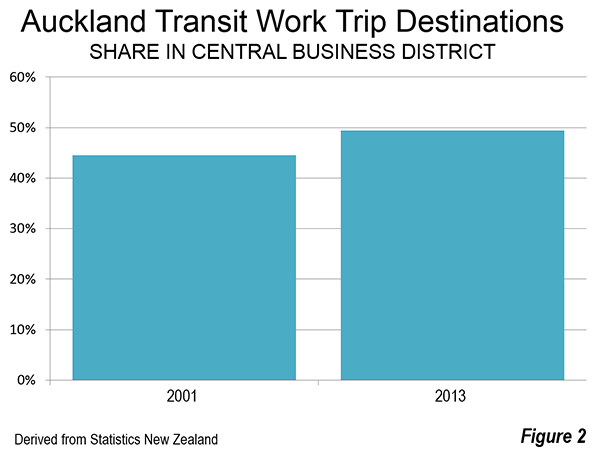
As is typical of large, more centrally oriented metropolitan areas, transit commuting is focused on the CBD in Auckland. In 2013, approximately 47 percent of all job locations accessed by transit in the metropolitan area were in the CBD. This was up from 45 percent in 2001 (Figure 2). More than one-half of the new transit commuters between 2001 and 2013 work in the CBD. This is despite the fact that the CBD represents only one percent of the built-up urban area.
Between the 2001 and 2013 censuses, Auckland experienced an increase in its transit work trip market share from 6.1 percent to 7.7 percent. However, as is typical of transit market shares, there was considerable variation. Transit carried 26.7 percent of the work trips to the CBD as designated by Statistics New Zealand. In the rest of the metropolitan area only 4.7 percent of the jobs were accessed by transit. Overall, transit carries 7,7 percent of work trips in Auckland (among commuters providing information), which is up from 6,1 percent in 2001. While this is a modest work trip market share, it is at least a full percentage point above that of urban planning model Portland.
Wellington
Wellington is the national capital and third largest metropolitan area with nearly 500,000 residents. But despite its smaller population, Wellington has the nation's largest CBD, by a whisker and by far the largest transit commute share in the nation.
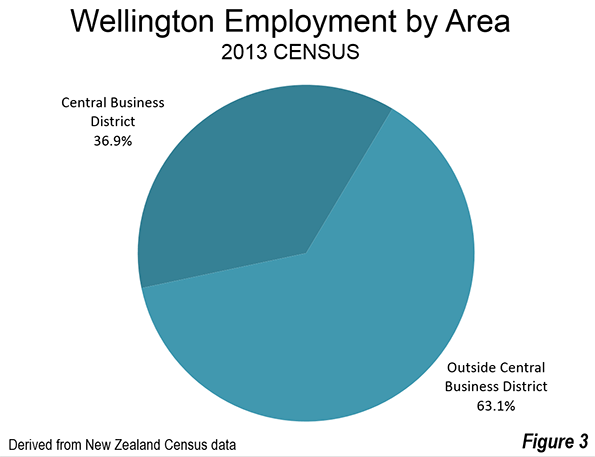
In 2013, Wellington's Statistics New Zealand designated CBD had approximately 80,000 jobs. This represents a very high 37 percent of the employment in the metropolitan area (Figure 3). While there are no comprehensive international CBD employment data, the anecdotal information indicates that this level of CBD employment is well above that of all major metropolitan areas in the United States, Canada and Australia, and two-thirds above New York, which has the highest CBD share of any major metropolitan area in these nations.
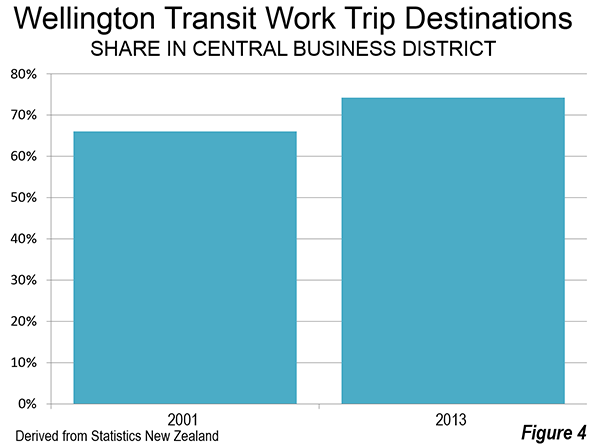
The dominance of the CBD in transit destinations is even more apparent in Wellington than in Auckland. In 2001, the CBD accounted for 66 percent of the transit commuting locations in the metropolitan area. By 2013 this increased to 74 percent. In fact all of the increase in transit work trips was to CBD locations, as commuting to other locations declined (Figure 4).
In 2013, transit carried 33.6 percent of employees to the CBD, up from 28.6 percent in 2001. Transit carried 6.2 percent of the travel to jobs outside the CBD. Overall, transit carried 15.7 percent of work trips in the metropolitan area, up from 14.7 percent in 2001. This is a sizeable transit market share, which would place Wellington ahead of all US metropolitan areas in the United States except New York and San Francisco.
Christchurch
Christchurch is New Zealand’s second largest metropolitan area, with nearly 600,000 residents.
Christchurch is a special case, due to the devastating earthquakes that hit the area in 2010 and 2011. Because of the disruption, the New Zealand government postponed the 2011 census to 2013.
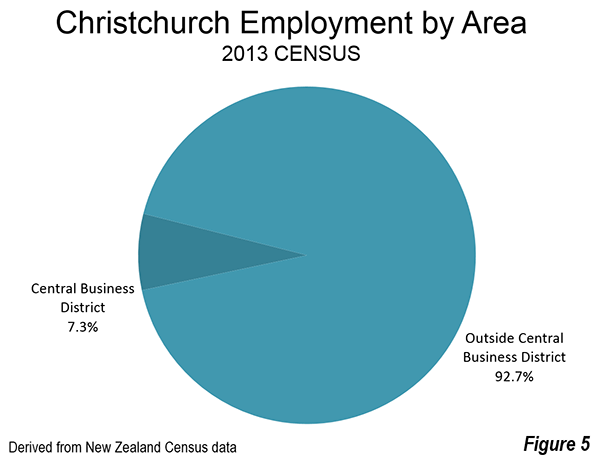
The core of Christchurch, Cathedral Square suffered particular damage, ruining the city's historic cathedral, the remains of which were demolished. The Statistics New Zealand designated CBD experienced a more than 50 percent loss in employment from the previous census (2006). In 2001, a very respectable 16.1 percent of employment was in the CBD. By 2013, that figure had declined to 7.3 percent (Figure 5).
Christchurch has not had the strength of transit ridership of Wellington or Auckland. In 2013, only 5.9 percent of CBD commuters used transit. Overall, transit carries approximately 2.3 percent of work trips in the Christchurch metropolitan area in 2013.
Transit is About Downtown
New Zealand's strongest CBD and transit markets provide further evidence that "transit is about downtown." Both Auckland and Wellington experienced comparatively strong increases in transit work trip ridership between 2001 and 2013. Yet most of the additional work transit work trip destinations were concentrated in the CBD in Auckland, and all of the new trips had CBD destinations in Wellington.
This is similar to the situation in the United States. In the US, 55 percent of transit commuting destinations are in the six municipalities (as opposed to metropolitan areas) that have the largest CBDs, measured by employment. Transit commuting is also heavily skewed toward the CBDs in Canada and Australia.
Wendell Cox is principal of Demographia, an international pubilc policy and demographics firm. He is a Senior Fellow of the Center for Opportunity Urbanism (US), Senior Fellow for Housing Affordability and Municipal Policy for the Frontier Centre for Public Policy (Canada), and a member of the Board of Advisors of the Center for Demographics and Policy at Chapman University (California). He is co-author of the "Demographia International Housing Affordability Survey" and author of "Demographia World Urban Areas" and "War on the Dream: How Anti-Sprawl Policy Threatens the Quality of Life." He was appointed to three terms on the Los Angeles County Transportation Commission, where he served with the leading city and county leadership as the only non-elected member. He served as a visiting professor at the Conservatoire National des Arts et Metiers, a national university in Paris.
Photograph: Downtown Auckland (by author)


