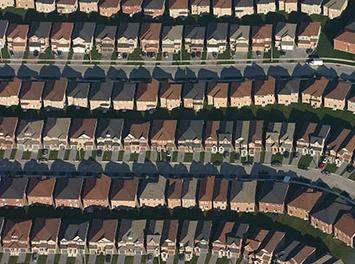
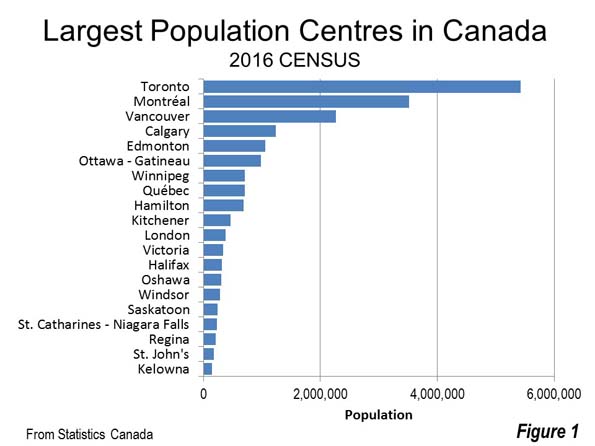
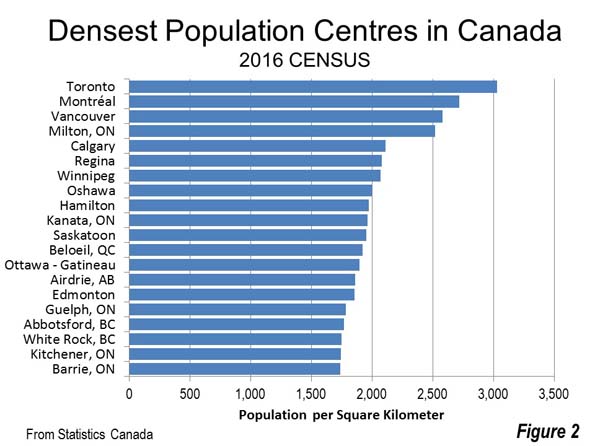
Canada is a nation of wide open spaces, yet it has high urban area densities recently driven higher by a redefinition of urban area criteria (Note 1). Canada's largest urban area (population centre) is Toronto, with a population of 5.4 million continues to be the densest of the 59 with more than 50,000 residents. Toronto has a population of 3,028 per square kilometer (7,843 per square mile), approximately five percent above the European Union average. Montréal (population of 3.5 million) has a density of 2,720 per square kilometer (7,045 per square mile), followed by third ranked Vancouver (2,584/6,693), which has a population of 2.2 million. The top ten is rounded out by Milton, a fast growing Toronto exurb with a density of 2,520 per square kilometer or 6.527 per square mile, Calgary (2,112/5,470), Regina, the capital of Saskatchewan (2,082/5,391) and Winnipeg, which has seen renewed recent growth (2,070/5,360).
Four other population centres have densities greater than 1,950 per square kilometer (5,000 per square mile , including Oshawa and Hamilton, which are adjacent to Toronto, as well as Saskatoon, Saskatchewan and Kanata, an exurb of Ottawa (Figure 2).
Comparisons to the United States
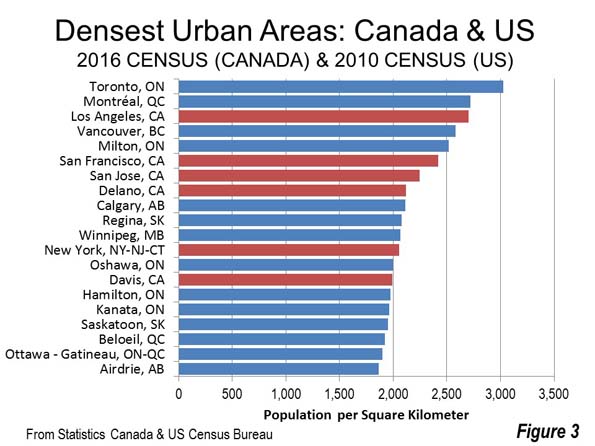
The new, higher density figures are not surprising considering the especially compact suburbs in view when landing at Pearson Airport in Toronto, or even in Calgary or Edmonton. A combined Canada-US urban area density list illustrates the higher density of Canadian urban areas relative to those in the United States. Among the five densest urban areas in Canada and the United States, four are in Canada. Los Angeles, the densest large urban area in the United States for the last three censuses, ranks third behind Toronto and Montréal. Vancouver and Milton rank fourth and fifth, just ahead of 6th ranked San Francisco. Immediately behind San Francisco is virtually all post-World War II suburban San Jose. Delano, California, an exurb of Bakersfield in the San Joaquin Valley has about 55,000 residents and ranks 8th on the combined list.
Residents of Calgary, Regina and Winnipeg, where densification advocates repeatedly condemn their perceived local urban sprawl (a pejorative term for urban dispersion) will doubtless be surprised to know that their population density exceeds that of New York. Only one more US urban area makes the top 20, Sacramento exurb Davis, at 14th, with a population of 73,000 (Figure 3).
Where's Portland?
To those inclined to venerate Portland's internationally famous densification policies, this list may be disconcerting. Calgarians who bemoan the inferiority of their city in relation to Portland should be heartened to find out that Calgary’s density is more than 50 percent higher than Portland's (Calgary’s transit market share is more than double Portland’s).
Portland is not among the densest 20 urban areas , but ranks 72nd, just behind all-suburban Riverside-San Bernardino and a bit ahead of Halifax. If Portland were in Canada, it would rank 38th in population density out of the largest 59 urban areas.
And Boston?
Boston has a reputation as one of the densest cities in the United States. Yet, Boston’s huge urban area is denser than only three of Canada's urban areas on the list, Belleville, ON, North Bay, ON and Fredericton, NB. Each is smaller than Boston suburb Somerville, which has about 75,000 residents. Among the urban areas of Canada and the US Boston is 218th in density. (Note 3).
Urban Containment Not Density Associated with Unaffordability
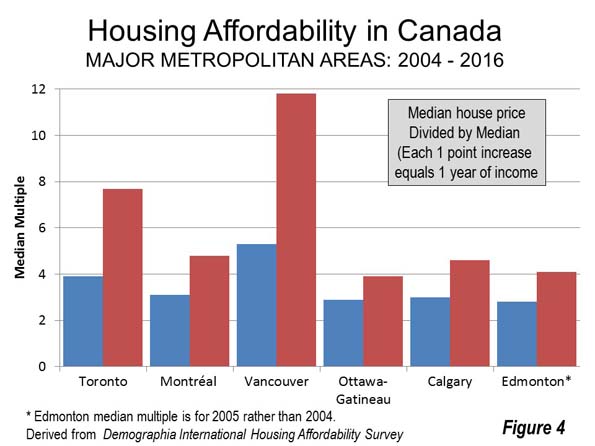
Canada’s urban areas illustrate that density does not have to mean unaffordable housing. There has been some densification since 2000, but Canada’s urban areas were nearly as dense even then. For example, in the last 15 years, the completely developed city of Toronto, with all its new residential towers, has added only 10 percent to its population. Five of Canada’s six major metropolitan areas Toronto, Montréal, Ottawa-Gatineau, Calgary and Edmonton were affordable at the beginning of the new century, hovering around a median multiple 3.0.
All that has changed, however, with the imposition of urban growth boundaries and equivalent policies. Ailin He and I showed in a Frontier Centre study (Canada’s Middle Income Housing Affordability Crisis) that house prices had “exploded” relative to household incomes between 2000 and 2015. This cannot be attributed to the modestly higher densities. The big change took place in land use policy, with, for example, Toronto and Calgary adopting urban containment policy that has been strongly associated with the destruction of housing affordability. Residents of Vancouver --- an urban area widely praised among planners --- have been paying the price for urban containment for much longer (Figure 4).
Canada’s experience up to the end of the 20th century proves that dense and affordable urban areas can be achieved. But since that time, as house prices have risen relative to incomes, Canada’s experience shows that all that can be reversed in an environment of binding urban containment policy.
Note 1: Between 2011 and 2016, Canada's urban areas increased more than 40 percent in population density, according to Statistics Canada data. This, however, was not a miracle of urban containment policy or smart growth, it was rather an improved method adopted by Statistics Canada for measuring urbanization. Urban areas are the "physical city," which unlike the metropolitan area has only urban land. Canada now calls its urban areas "population centres," having changed to the new label in 2011, when the United Kingdom labeled them "built up urban areas."
In 2011 and before, the Census had used municipalities as building blocks for urban areas. Often, those municipalities included large swaths of rural land (as did Los Angeles until well into the 1950s). Now, the building blocks for urban areas in Canada are "blocks", the lowest enumeration geography of the Census (the same revision was implemented by the US Census in 2000). Under the old definition, Canada's urban areas had a density of 1,180 per square kilometer (3,057 per square mile) in 2011. Now it is 1,698 per square kilometer (4,397 per square mile), a 44 percent increase.
Note 2: The comparisons are between the 2016 Census of Canada data and the 2010 US Census data, since urban area (population centre) data is only developed in the censuses (the next US census will be in 2020). The list is developed from the 59 urban areas in Canada and the 499 in the United States with 50,000-plus residents in the last censuses.
Note 3: A recent article found Boston to be almost five times as dense as Houston. However, this was in municipal (inside the city limits) density. City limits are artificial, political constructs that have nothing to with the organic city (the physical city , also called urban area or the economic city, or the metropolitan area , which is the labor market). The Houston urban area, with its reputation for "sprawl" is actually one-third denser (1150/2979 ) than Boston's (856 /2,278). At the physical city level, the urban area is the best indication of urban density. Using metropolitan density as an indicator of urban density is nonsensical, since all metropolitan areas include substantial rural territory.
Wendell Cox is principal of Demographia, an international public policy and demographics firm. He is a Senior Fellow of the Center for Opportunity Urbanism (US), Senior Fellow for Housing Affordability and Municipal Policy for the Frontier Centre for Public Policy (Canada), and a member of the Board of Advisors of the Center for Demographics and Policy at Chapman University (California). He is co-author of the "Demographia International Housing Affordability Survey" and author of "Demographia World Urban Areas" and "War on the Dream: How Anti-Sprawl Policy Threatens the Quality of Life." He was appointed to three terms on the Los Angeles County Transportation Commission, where he served with the leading city and county leadership as the only non-elected member. He served as a visiting professor at the Conservatoire National des Arts et Metiers, a national university in Paris.
Photo: Suburban density in Toronto (Markham) by IDuke - English Wikipedia, CC BY-SA 2.5


