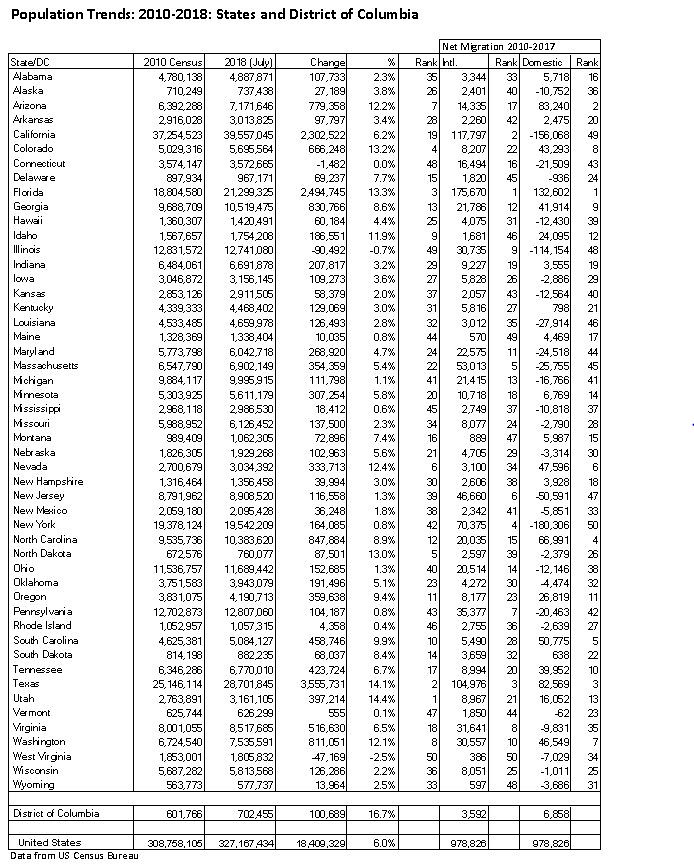
The new Census Bureau population estimates for the states have been released. The nation has experienced its slowest growth since 1938, adding only 0.6 percent to the population between 2017 and 2018, according to Brookings Institution demographer Bill Frey. Overall, since 2010, the nation has gained 6.0 percent in population and now has 327.2 million residents. This is an increase of 18.4 million.
The table below provides 2010 and 2018 population, 2010 to 2018 population growth, net domestic migration and net international migration for all states and the District of Columbia.
Utah grew the fastest over the past eight years, adding 14,4 percent new residents. Texas was close behind, at 14.1 percent. Six other states grew at more than double the national rate (12 percent or more): Florida, Colorado, North Dakota, Nevada, Arizona, and Washington. The District of Columbia had a larger growth rate than any state, at 16.7 percent.
Three states lost population, with West Virginia down by far the most (-2.5 percent). Illinois lost 0.7 percent, while Connecticut’s had 0.04 percent loss.
Florida again led the nation in net domestic migration, with 133,000. Arizona was second at 83,200 and displaced Texas at 82,600. North Carolina and South Carolina added between 50,000 and 70,000. The second five in the top ten were Nevada, Washington, Colorado, Georgia and Tennessee, with from 40,000 to 48,000 net domestic migrants.
New York again lost the most domestic migrants, at 180,000, down from last year’s peak for the decade of 193,000. California’s net domestic out-migration continued to intensify, with a loss of 156,000, which has steadily risen from 41,000 in 2011. Illinois, where the housing is considerably more affordable than California, but lacks the economy of either the Golden State or the Empire State, lost 114,000 net domestic migrants, but was displaced in with the second largest exodus by California after 2016. New Jersey lost a net 51,000 domestic migrants.
Considerably smaller losses were sustained by Louisiana, Massachusetts, Maryland, Connecticut, Pennsylvania and Michigan, which shed from 28,000 to 17,000 net domestic migrants.
Florida had by far the largest net international migration, at 176,000, while California gained 118,000. Texas also added more than 100,000 international migrants (105,000). Four states added fewer than 1,000 net international migrants. West Virginia had the least, at under 400 and was joined by Maine, Wyoming and Montana with fewer than 1,000.
By region, overall net domestic migration indicated a continuing pattern of movement to the South. Between 2010 and 2017, the South gained 3.1 million net domestic migrants. The West was a poor second, at 700,000. The Northeast lost 2.2 million and the Midwest lost 1.7 million.
Additional data will be released in the first half of 2019 for metropolitan areas, counties and municipalities.

Wendell Cox is principal of Demographia, an international public policy and demographics firm. He is a Senior Fellow of the Center for Opportunity Urbanism (US), Senior Fellow for Housing Affordability and Municipal Policy for the Frontier Centre for Public Policy (Canada), and a member of the Board of Advisors of the Center for Demographics and Policy at Chapman University (California). He is co-author of the "Demographia International Housing Affordability Survey" and author of "Demographia World Urban Areas" and "War on the Dream: How Anti-Sprawl Policy Threatens the Quality of Life." He was appointed to three terms on the Los Angeles County Transportation Commission, where he served with the leading city and county leadership as the only non-elected member. He served as a visiting professor at the Conservatoire National des Arts et Metiers, a national university in Paris.
Photo: Made by Ali Zifan [CC BY-SA 3.0], via Wikimedia Commons


