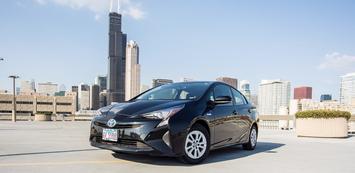
While the media tends to studiously report – and often sensationalize – the latest developments involving Airbnb, e-scooters, and ride-hailing (especially Lyft and Uber), another booming “sharing economy” sector has recently been gaining attention. Peer-to-peer carsharing enables individuals to make their privately-owned vehicles available to others for short periods of time at a fee of the owner’s choosing. Peer-to-peer carsharing differs from neighborhood carsharing platforms, such as car2go and Zipcar, where vehicles are owned by corporate and nonprofit entities, some of which require vehicles to be picked up at and returned to designated pods. Instead, peer-to-peer carsharing allows vehicles to be made available virtually anywhere, including at a host’s residence or a dedicated parking space.
The big players in peer-to-peer carsharing, including Turo and Getaround, offer online platforms in which “hosts” can share their private vehicles at times when they are not needed for personal use, such as on certain days of the week or holidays. Depending on the vehicle, prices typically range from $30 to $80 per day. The user of the car is responsible for refilling the tank, cleaning, and paying for any vehicle damage. Transactions are handled through a centralized app, with the online platform keeping a portion (typically around 25 percent) of the fees paid.
Last week, DePaul University released our new study showing that participation in this sector is a pretty sweet deal for people who share cars that they would own anyway, irrespective of their decision to share. We evaluated anonymized data provided to us by Turo, a profit-oriented online peer-to-peer carsharing platform. Turo encompasses 8,244 trips totalling almost 30,000 days of shared vehicle use in Illinois. The study, while independently conducted, was--full disclosure--commissioned by Turo.
Few trips involve merely quick roundtrips to the grocery store: The average trip (3.2 days) is much longer than the typical car2go or Zipcar trip, which rent on a per minute or per-hour basis. Users drive an average of 104 miles per day, and only about 4% of trips involve average mileages fewer than 25 miles per day, while 11% average over 200 miles per day. The average rate hovers around $54 per day, before considering the “extras” (such as unlimited mileage) for which some consumers pay.
Hosts must consider the wear-and-tear associated with the mileage put on their vehicles as well as the cleaning costs and other expenses. Maintenance costs are typically around 10 – 11 cents per mile driven. Overall, we found, the costs to hosts averaged to about $15 per “sharing day”, but revenues, after deducting fees kept by Turo for use of the platform, averaged $43, resulting in a net margin (“profit”) averaging $28 per sharing day. More than 94% of auto and SUV trips were profitable to the host, as were about four-in-five of minivan trips (Table 1).
Table 1. Financial Results by Vehicle Type

* Results reflect the financial returns for hosts who would own their car irrespective of their decision to “share it.” Net margins are based on revenues paid to the host after deducting fees for using the online platform.
We only looked at the financial benefits and costs, and not non-monetary factors, such as the time a host spends or the opportunity costs of lending out your wheels. Still, a takeaway is that peer-to-peer carsharing is helping cash-strapped households make ends meet. For a family earning $40,000 per year, the expected $2,500 earned sharing a vehicle for 90 days per year boosts net income by 6.3. For this household, sharing covers almost half of a typical car payment.
Peer-to-peer carsharing isn’t confined to tech-savvy upwardly mobile professionals. Almost two-thirds of the trips studied took place in zip codes that have unemployment rates higher than the statewide average. Communities with peer-to-peer carsharing activity have higher average rates of unemployment (7% vs. 5%), renter occupancy (35% vs. 23%), and almost three times the share of minority population (44% vs. 15%) compared to the state average.
Participation is also more “democratic” than most other sharing economy offerings. For instance, the distribution of listings is far more dispersed than Airbnb, where hosts tend to be heavily concentrated in certain neighborhoods and tourist areas (see Figure 1). Good luck finding a bike-share vehicle in most neighborhoods offering Turo listings.
Figure 1. Distributions of Turo and Airbnb Listings Rates (000s per household) by Zip Code, City of Chicago

These maps show that Turo hosts tend to be dispersed more widely across the city’s neighborhoods than Airbnb hosts. Each dot represents an online listing. Data sources: Turo; Airbnb, 2018
Curiously, both the media and urban analysts have largely ignored the mobility benefits afforded by peer-to-peer carsharing—and the boost it provides to households. Much of the attention is going to the ongoing regulatory challenges. That will hopefully change as the sector picks up speed and more people discover that an extra set of wheels is right down the block.
Joseph Schwieterman, Ph.D., is director of the Chaddick Institute for Metropolitan Development at DePaul University in Chicago. C. Scott Smith, Ph.D., serves as the institute’s assistant director. Their study An Engine for Earning: Estimating the Financial Benefits of Peer-to-Peer Carsharing to Vehicle Hosts, was released last week.
Photo: Private vehicle in Chicago, IL available on Turo.com, an app-based online platform.


