The six transit legacy cities - mostly urban cores that grew largely before the advent of the automobile - increased their concentration of transit work trips to 57.9% of the national transit commuting, according to the 2018 American Community Survey. At the same time, working at home strengthened its position as the nation’s third leading mode of work access, with transit falling to fourth. The transit commuting market share dropped from 5.0% in 2017 to 4.9% in 2018. Carpooling, after at least three decades of decline, has seen an increase in this decade.
Concentration of Transit Commuting Destinations in Legacy Cities
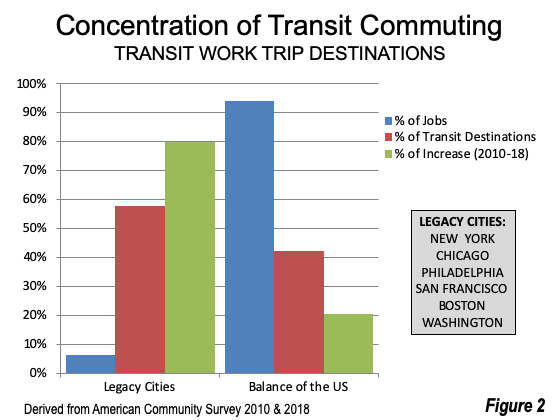
Based on transit work trip destinations (as opposed to residences of commuters) the cities of New York, Chicago, Philadelphia, San Francisco, Boston and Washington increased their share of commuting by 4.8% (2.6% points) in just eight years (from 2010 to 2018). The legacy cities are home to the six largest downtown areas (central business districts) in the United States, the destination for most of their transit commuting.
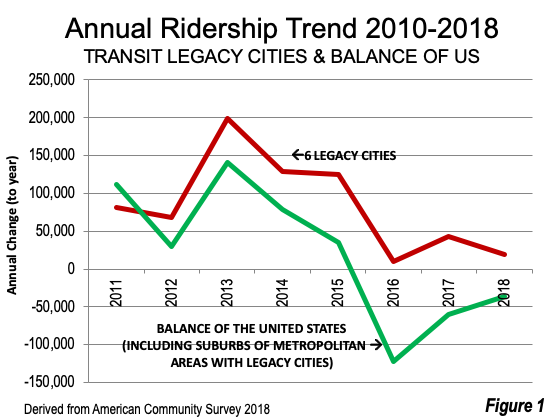
This increased concentration occurred even as transit commuting has begun to trend downward, from the 2015, the peak ridership post-1960 year (Figure 1). The transit legacy cities accounted for 6.1% of the nation’s employment in 2018. Their 57.9 share of transit commuting is nearly 10 times their equivalent share of jobs. The more favorable performance of the legacy cities in this decade resulted in their garnering 79.7%% of the increased commuting, more than 13 times their share of jobs.
The intensity of the concentration is illustrated in Figure 2, which compares employment, transit commuting and transit commuting increase (2010 to 2018) shares for legacy cities and the balance of the nation. The work trip market share to the legacy cities is 47%. By comparison, in the rest of the nation, transit’s work trip share is a miniscule 2.1%. Only 19 of the nation’s 53 major metropolitan areas has a transit work trip share of 3.0% or more.
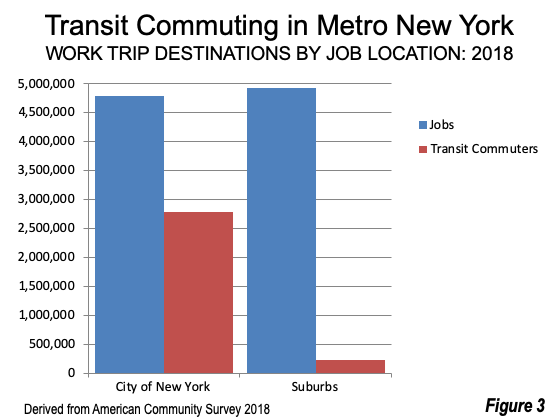
However, to get to jobs outside the legacy cities (in the same metropolitan areas), transit commuting is only 8.6% of the national total. Strikingly, in New York, nearly 51% percent of the jobs are outside the city of New York. Transit’s share to these jobs is only 4.4%, a fraction of the 58.0% who use transit to jobs in the city of New York (the urban core)(Figure 3). Large differences between transit commuting to downtown and the suburbs occurs in most major metropolitan areas, not just those with legacy cities.
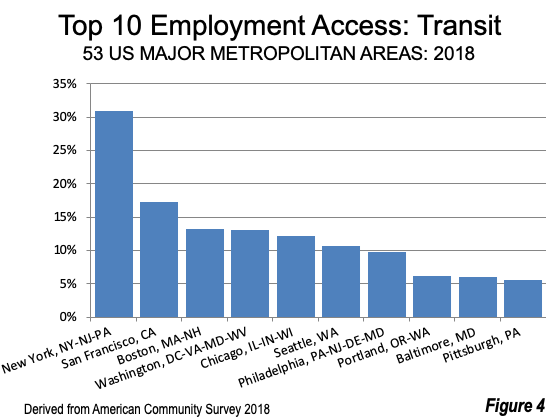
New York continues to have by far the largest transit commute share, at 30.9% (Figure 4). The lowest transit commute shares are in Birmingham and Oklahoma City, at 0.6%. Transit work trip data is provided in the Table below by mode.
Working at Home: The Big Winner
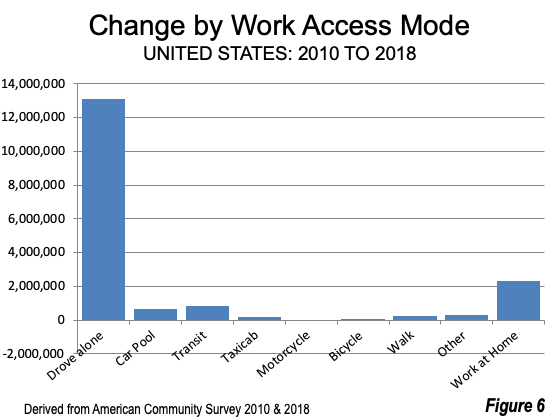
The American Community Survey data reveals working at home continues to be the big winner among the most popular employment access modes. Between 2017 and 2018, working at home (which includes telecommuting) gained 258,000 workers nationally, rising from 8.00 to 8.25 million in total. This was a considerable accomplishment. Working at home increased disproportionately relative to driving alone. Having only 7% of the driving alone volume in 2017, working at home added more than 20% of the entire commuting increase over the last year.
Working at home strengthened its number three position, following driving alone and vehicle pools, and now exceeding transit by more than 600,000. In 44 of the 53 major metropolitan areas, working at home accounted for more employment access than transit. The nine exceptions, in which transit led working at home included the six metropolitan areas with “legacy cities” plus Seattle, Pittsburgh and Baltimore. Overall, working at home has increased 2.3 million since 2010. It now has a market share of 5.3%, up from 4.3% in 2010.
Raleigh again had the highest work at home market share, at 9.1%, followed by Austin, Denver, Portland and San Francisco. The great advantage of working at home is that it reduces traffic, and does so without public subsidy (Figure 5). The work at home market shares exceeded that of transit in all but one of the ten top metropolitan areas (San Francisco, with its legacy city). Meanwhile, among the other nine strongest work at home metropolitan areas, seven have built expensive rail systems. Each of these has cost from hundreds of millions to billions of tax dollars. Yet, working at home, which is virtually unsubsidized has attracted substantially greater use.
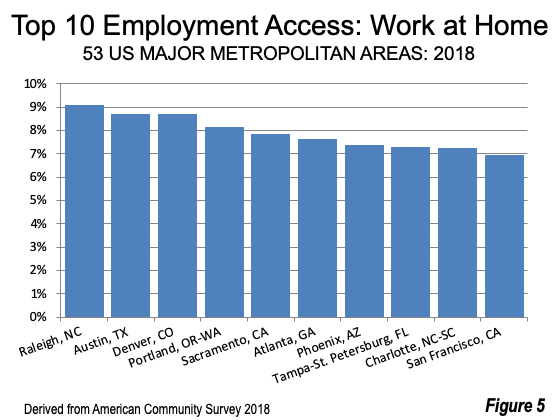
Working at home exhibits little of the concentration observed in transit. All 53 of the major metropolitan areas have work at home shares of 2.5% or more. By contrast, 28 major metropolitan areas have transit commuting shares below 2.5%. Memphis had the lowest work at home share. Second lowest Buffalo, at 3.5% had a work at home market share larger than the transit market shares in 39 major metropolitan areas.
Carpool Resurgence
Carpools increased 300,000 between 2017 and 2018 and more than 600,000 since 2010. This follows decades of decline. This, however, was not enough to keep the mode from falling to 9.0% of the market in 2018 from 9.7% in 2017. There were 19.1 million carpools in 1980, the first year carpool data was collected and only 13.9 million now. The high market share was in Salt Lake City, at 12.0% (Figure 6), while the lowest was in New York, at 6.3%.
Ride Hailing
The data show a huge increase in taxicab use, which is probably due to recently initiated ride hailing services like Uber and Lyft. Taxicab commuting has increased more than 150%, from 150,000 to 360,000. The impact may be even greater. “Other” means of commuting increased almost 300,000, for a 25% increase. This was greater than that of all other modes of employment access, except for work and home and taxicab. It is not hard to imagine some respondents ticking “other” if they did not associate these new services with “taxicab.”
Work Access: Niche Markets and Mass Markets
While transit used to serve the largest share of motorized urban trips (probably about 90 years ago, but I have found no data), it has become a “niche” market among commuters who have a choice (have a car).Transit is about downtown and the urban core, with much of the share of transit commuting being destinations in these areas. Mind you, these are important markets, but they are small in the overall context of employment and transit’s access to metropolitan area jobs is miniscule.
The other three largest modes, cars, car pools and working at home serve broad markets. They can reach virtually any job in the metropolitan area, or in the case of working at home, many jobs around the world. That’s why those three modes hold a near monopoly on commuting, and represent most of its growth. With them, you can get from here to there.
EMPLOYMENT ACCESS BY MEANS OF ACCESS |
|||||||||
| US Major Metroopolitan Areas: 2018 | |||||||||
| Drive Alone | Car Pool | Transit | Taxi | Motor-Cycle | Bicycle | Walk | Other | Home | |
| Atlanta, GA | 77.3% | 8.9% | 3.0% | 0.5% | 0.1% | 0.2% | 1.3% | 1.2% | 7.6% |
| Austin, TX | 76.9% | 8.7% | 1.9% | 0.1% | 0.2% | 0.8% | 1.9% | 0.7% | 8.7% |
| Baltimore, MD | 77.0% | 8.0% | 6.0% | 0.3% | 0.0% | 0.3% | 2.4% | 0.8% | 5.3% |
| Birmingham, AL | 84.8% | 8.8% | 0.6% | 0.0% | 0.1% | 0.0% | 0.9% | 0.6% | 4.2% |
| Boston, MA-NH | 66.1% | 7.0% | 13.2% | 0.3% | 0.0% | 1.1% | 5.6% | 1.0% | 5.5% |
| Buffalo, NY | 82.1% | 6.8% | 3.1% | 0.2% | 0.1% | 0.4% | 3.0% | 0.8% | 3.5% |
| Charlotte, NC-SC | 79.2% | 9.4% | 1.5% | 0.2% | 0.1% | 0.1% | 1.4% | 0.9% | 7.3% |
| Chicago, IL-IN-WI | 69.8% | 8.0% | 12.1% | 0.3% | 0.1% | 0.7% | 2.8% | 0.9% | 5.4% |
| Cincinnati, OH-KY-IN | 81.6% | 8.2% | 1.7% | 0.1% | 0.0% | 0.2% | 2.2% | 0.8% | 5.1% |
| Cleveland, OH | 81.6% | 7.9% | 2.7% | 0.1% | 0.0% | 0.4% | 1.9% | 0.8% | 4.6% |
| Columbus, OH | 81.3% | 8.2% | 1.7% | 0.1% | 0.1% | 0.3% | 2.2% | 0.7% | 5.5% |
| Dallas-Fort Worth, TX | 80.8% | 9.5% | 1.3% | 0.1% | 0.1% | 0.1% | 1.3% | 0.9% | 5.8% |
| Denver, CO | 75.0% | 8.2% | 3.8% | 0.2% | 0.1% | 0.9% | 2.4% | 0.8% | 8.7% |
| Detroit, MI | 83.2% | 8.6% | 1.3% | 0.2% | 0.1% | 0.2% | 1.4% | 0.7% | 4.3% |
| Grand Rapids, MI | 82.0% | 9.1% | 1.4% | 0.1% | 0.1% | 0.4% | 2.2% | 0.5% | 4.2% |
| Hartford, CT | 81.2% | 7.7% | 2.6% | 0.1% | 0.0% | 0.2% | 1.8% | 0.8% | 5.7% |
| Houston, TX | 81.0% | 9.4% | 2.0% | 0.1% | 0.1% | 0.2% | 0.9% | 1.3% | 4.9% |
| Indianapolis. IN | 83.4% | 8.0% | 0.9% | 0.1% | 0.1% | 0.2% | 1.3% | 1.0% | 5.0% |
| Jacksonville, FL | 80.3% | 8.5% | 0.9% | 0.1% | 0.2% | 0.6% | 1.6% | 1.5% | 6.4% |
| Kansas City, MO-KS | 83.8% | 7.8% | 0.9% | 0.2% | 0.1% | 0.2% | 1.2% | 0.7% | 5.2% |
| Las Vegas, NV | 78.7% | 9.8% | 3.3% | 0.2% | 0.3% | 0.2% | 1.4% | 2.1% | 4.1% |
| Los Angeles, CA | 75.0% | 9.5% | 4.8% | 0.3% | 0.3% | 0.6% | 2.5% | 1.1% | 5.9% |
| Louisville, KY-IN | 82.2% | 8.5% | 1.7% | 0.0% | 0.0% | 0.3% | 1.3% | 1.0% | 4.9% |
| Memphis, TN-MS-AR | 86.1% | 9.0% | 0.7% | 0.1% | 0.1% | 0.2% | 0.9% | 0.6% | 2.5% |
| Miami, FL | 77.7% | 9.2% | 3.1% | 0.5% | 0.2% | 0.7% | 1.4% | 1.4% | 5.7% |
| Milwaukee,WI | 81.5% | 7.5% | 2.6% | 0.2% | 0.1% | 0.5% | 2.3% | 0.3% | 5.0% |
| Minneapolis-St. Paul, MN-WI | 77.4% | 8.1% | 4.5% | 0.2% | 0.1% | 0.8% | 2.4% | 0.6% | 5.9% |
| Nashville, TN | 80.9% | 9.2% | 0.8% | 0.2% | 0.1% | 0.1% | 1.5% | 1.0% | 6.2% |
| New Orleans. LA | 78.6% | 9.3% | 2.6% | 0.3% | 0.1% | 1.2% | 2.5% | 0.9% | 4.5% |
| New York, NY-NJ-PA | 50.3% | 6.3% | 30.9% | 0.8% | 0.0% | 0.7% | 5.5% | 0.8% | 4.7% |
| Oklahoma City, OK | 82.9% | 8.8% | 0.6% | 0.1% | 0.1% | 0.2% | 2.1% | 1.0% | 4.2% |
| Orlando, FL | 80.3% | 10.4% | 1.3% | 0.3% | 0.3% | 0.3% | 1.1% | 0.9% | 5.0% |
| Philadelphia, PA-NJ-DE-MD | 72.3% | 7.2% | 9.8% | 0.3% | 0.1% | 0.6% | 3.4% | 0.8% | 5.5% |
| Phoenix, AZ | 75.8% | 11.2% | 1.8% | 0.3% | 0.3% | 0.7% | 1.3% | 1.2% | 7.4% |
| Pittsburgh, PA | 76.6% | 8.3% | 5.6% | 0.1% | 0.1% | 0.3% | 3.4% | 0.5% | 5.1% |
| Portland, OR-WA | 70.4% | 8.8% | 6.1% | 0.2% | 0.2% | 2.0% | 3.4% | 0.7% | 8.1% |
| Providence, RI-MA | 81.3% | 8.5% | 2.4% | 0.2% | 0.0% | 0.2% | 3.0% | 0.6% | 3.8% |
| Raleigh, NC | 79.0% | 8.9% | 0.9% | 0.2% | 0.1% | 0.1% | 1.3% | 0.5% | 9.1% |
| Richmond, VA | 81.2% | 8.7% | 1.7% | 0.3% | 0.1% | 0.7% | 1.4% | 0.9% | 5.2% |
| Riverside-San Bernardino, CA | 79.8% | 10.9% | 1.2% | 0.1% | 0.3% | 0.2% | 1.5% | 1.0% | 5.0% |
| Rochester, NY | 80.9% | 7.9% | 2.2% | 0.2% | 0.2% | 0.5% | 3.0% | 0.4% | 4.8% |
| Sacramento, CA | 76.6% | 9.2% | 2.2% | 0.2% | 0.3% | 1.3% | 1.7% | 0.8% | 7.9% |
| St. Louis,, MO-IL | 83.6% | 6.9% | 2.1% | 0.1% | 0.1% | 0.2% | 1.8% | 0.6% | 4.6% |
| Salt Lake City, UT | 74.5% | 12.0% | 3.2% | 0.1% | 0.2% | 0.7% | 2.2% | 0.5% | 6.7% |
| San Antonio, TX | 79.2% | 11.2% | 1.8% | 0.1% | 0.1% | 0.2% | 1.8% | 1.0% | 4.6% |
| San Diego, CA | 76.5% | 8.8% | 2.6% | 0.2% | 0.5% | 0.4% | 3.1% | 1.2% | 6.6% |
| San Francisco, CA | 57.2% | 9.6% | 17.3% | 0.7% | 0.4% | 1.9% | 4.7% | 1.2% | 7.0% |
| San Jose, CA | 75.3% | 10.3% | 4.0% | 0.3% | 0.3% | 1.6% | 2.2% | 0.9% | 5.0% |
| Seattle, WA | 66.1% | 10.0% | 10.7% | 0.3% | 0.3% | 1.1% | 4.1% | 0.7% | 6.7% |
| Tampa-St. Petersburg, FL | 78.9% | 9.0% | 1.3% | 0.3% | 0.2% | 0.5% | 1.4% | 1.1% | 7.3% |
| Tucson, AZ | 76.8% | 10.0% | 2.1% | 0.2% | 0.4% | 1.5% | 2.1% | 1.3% | 5.5% |
| Virginia Beach-Norfolk, VA-NC | 81.2% | 8.5% | 1.4% | 0.1% | 0.1% | 0.4% | 2.8% | 1.0% | 4.4% |
| Washington, DC-VA-MD-WV | 65.8% | 9.2% | 13.0% | 0.5% | 0.1% | 0.9% | 3.3% | 1.0% | 6.1% |
| UNITED STATES | 76.3% | 9.0% | 4.9% | 0.2% | 0.1% | 0.5% | 2.6% | 0.9% | 5.3% |
| Derived from American Community Survey 2018. | |||||||||
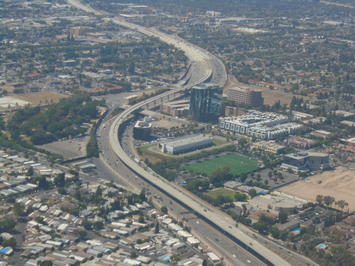
Photograph: Interstate 5 in Orange County California, with elevated express lanes (by author)
Wendell Cox is principal of Demographia, an international public policy and demographics firm. He is a Senior Fellow of the Center for Opportunity Urbanism (US), Senior Fellow for Housing Affordability and Municipal Policy for the Frontier Centre for Public Policy (Canada), and a member of the Board of Advisors of the Center for Demographics and Policy at Chapman University (California). He is co-author of the "Demographia International Housing Affordability Survey" and author of "Demographia World Urban Areas" and "War on the Dream: How Anti-Sprawl Policy Threatens the Quality of Life." He was appointed by Mayor Tom Bradley to three terms on the Los Angeles County Transportation Commission, where he served with the leading city and county leadership as the only non-elected member. Speaker of the House of Representatives appointed him to the Amtrak Reform Council. He served as a visiting professor at the Conservatoire National des Arts et Metiers, a national university in Paris.


