NewGeography.com blogs
Since Rahm Emanuel entered the political scene years ago, he’s been a master at manipulating the press to his benefit. A pliant media has largely gone along with whatever talking point Emanuel desired. Lately, some of the media has begun to put the spotlight on violent Chicago with its rather high murder rate. Banning or restricting handguns has not been very successful in combatting violence in Chicago. The website Big Government reports the bloody details:
After Chicago recorded a terrible homicide total of 53 in August, September wasn't much better for Rahm's "world class" city. The city suffered 41 homicides, 30 of which resulted from 184 total shootings.
September brings more bad news for Chicago residents. While Mayor Rahm Emanuel, Police Superintendent Garry McCarthy, and the Chicago media have continued to hammer the point that the "crime rate is down," and "murder is down," as of September 22, the homicide total for 2013 now exceeds the rate up to the same date in 2011 by two percent at 350, according to the Chicago Police Crime Data Portal.
How does today’s Chicago hold up at the violent memory of Al Capone’s Chicago of the 1920s? Not very well. WLS-TV investigated the data and the evidence is rather stunning report in February:
Let's compare two months: January 1929, leading up to the St. Valentine's Day Massacre, and last month, January 2013. Forty-two people were killed in Chicago last month, the most in January since 2002, and far worse than the city's most notorious crime era at the end of the Roaring Twenties.
Even though the image of Chicago, perpetuated by Hollywood over the years, was that mobsters routinely mowed down people on the streets, the crime stats tell us that we were safer under Capone than Emmanuel. In January 1929 there were 26 killings. Forty-two people were killed in Chicago last month, the most in January since 2002.
Even though the image of Chicago, perpetuated by Hollywood over the years, was that mobsters routinely mowed down people on the streets, the crime stats tell a different story. The figures from January 2013 are significantly higher than the January of Al Capone's most famous year.
It’s not just the Capone era violence that doesn’t hold up to scrutiny. Constantly we hear from the media and advocates of gun control that we don’t want things to become “the Wild West”. In the last several years, historians have begun to look at this long time legend that was promoted by Hollywood movies. As Ryan McMaken explains:
Historian Richard Shenkman largely attributes this to the legacy of those reliably-violent Western films. "Many more people have died in Hollywood Westerns than ever died on the real Frontier…[i]n the real Dodge City, for example, there were just five killings in 1878, the most homicidal year in the little town's Frontier history: scarcely enough to sustain a typical two-hour movie."
The old West with its minimal government and armed populace has never been too popular with progressives. But, the reality is it was never really violent according to Terry Anderson and Peter Hill. So, the murder rate of the Capone era and Dodge city of 1878 would be a major improvement for Mayor Rahm Emanuel.
Note: This post was originally incorrectly attributed to Wendell Cox.
Congratulations to Bob Day, who was elected as a federal Senator from South Australia. Day was one of six Senators elected from the state in the September 7 election. While most of the seats in the lower house of Parliament were quickly decided, the Senate seats too considerably longer under Australia’s preferential voting system. According to the Australian Broadcasting Company, Day’s election and that of the other five Senators was confirmed on October 2.
Day is an ultimate entrepreneur, having founded Home Australia and related companies that has emerged as a leading home builder across the nation. He served a term as President of the Housing Industry Association. Day has also been a newgeography.com author, writing a piece on one of his passions, the importance of restoring housing affordability in Australia (see The Land Premium that’s Punishing Property).
Remember this?
The fact remains that Congress has not passed a real federal budget since 1997 (“the first balanced budget in a generation”.) An “omnibus spending bill” was passed in April of 2009 but that is not technically a budget.
Congressional inaction has left the federal government running on extensions (“Continuing Resolutions”) of a budget that was passed when Bill Gates was still CEO of Microsoft, NASA landed the first spacecraft on Mars, and Google was working out of a garage. The last federal budget is from the time before iPods and iPads, before SPAM e-mail exceeded legitimate email, before Facebook, YouTube and Twitter – and before the global financial crisis that sent the world into recession and US federal spending into the stratosphere.
(“This is Your Government on Crack,” by Susanne Trimbath 02/12/2013).
As one very famous Republican President said (repeatedly in his defeat of Jimmy Carter): “There you go again!”
And, sure, this isn’t the first time the federal government has shut down for lack of spending authorization. I remember when my elderly mother and her sisters – first generation Americans eager to see the place where their parents disembarked after their long ocean voyage from Sicily – were so disappointed to find Ellis Island and the Status of Liberty closed that October of 1996.
The big difference this time is the way government is spending – which I discuss in detail in the article quoted above. USAToday has an article that summarizes just how different the government operates today than it did 17 years ago. There is a big reason Republicans might want to re-think shutting down the government. According to USAToday, gun permits cannot be issued while the federal government is closed.
Let’s hope one thing is the same in 2013 as it was in 1996 – when they re-opened the government Congress passed a real budget.
Over the last decade, progressives have successfully painted conservative climate skepticism as the major stumbling block to reducing greenhouse gas emissions. Exxon and the Koch brothers, the story goes, fund conservative think tanks to sow doubt about climate change and block legislative action. As evidence mounts that anthropogenic global warming is underway, conservatives’ flight from reason is putting us all at risk.
This week's release of a new United Nations Intergovernmental Panel on Climate Change report opens another front in the climate wars. But beneath the bellowing, name-calling, and cherry-picking of data that have become the hallmark of contemporary climate politics lies a paradox: the energy technologies favored by the climate-skeptical Right are doing far more to reduce greenhouse gas emissions than the ones favored by the climate-apocalyptic Left.
How much more? Max Luke of Breakthrough Institute ran the numbers and found that, since 1950, natural gas and nuclear prevented 36 times more carbon emissions than wind, solar, and geothermal. Nuclear avoided the creation of 28 billion tons of carbon dioxide, natural gas 26 billion, and geothermal, wind, and solar just 1.5 billion.
Environmental leaders who blame "global warming deniers" for preventing emissions reductions point to Germany's move away from nuclear and to renewables. "Germany is the one big country that’s taken this crisis seriously," wrote Bill McKibben. Other progressive and green leaders, including Al Gore, Bill Clinton, and Bobby Kennedy, Jr., have held up Germany's "energy turn," theEnergiewende, as a model for the world.
But for the second year in a row, Germany has seen its coal use and carbon emissions rise — a fact that climate skeptical conservatives have been quick to point out, and liberal environmental advocates have attempted to obfuscate. "Last year, Germany’s solar panels produced about 18 terawatt-hours (that’s 18 trillion watt-hours) of electricity," noted Robert Bryce from the conservative Manhattan Institute. "And yet, [utility] RWE’s new coal plant, which has less than a 10th as much capacity as Germany’s solar sector, will, by itself, produce about 16 terawatt-hours of electricity.
Reagan historian Steven Hayward, formerly of the American Enterprise Institute, noted in the conservative Weekly Standard earlier this week, "Coal consumption wentup 3.9 percent in Germany last year. Likewise, German greenhouse gas emissions — the chief object of Energiewende — rose in Germany last year, while they fell in the United States."
Emissions fell in the United States thanks largely to a technology loathed by the Left:fracking. From 2007 to 2012, electricity from natural gas increased from 21.6 to 30.4 percent, while electricity from coal declined from 50 to 38 percent — that's light speed in a notoriously slow-changing sector. And yet the Natural Resources Defense Council, Sierra Club, and most other green groups are working to oppose the expansion of natural gas.
Hayward and Bryce are two of the most respected writers on energy and the environment on the Right. Both are highly skeptical that global warming poses a major threat. Both regularly criticize climate scientists and climate models. Both men are regularly attacked by liberal organizations like Media Matters for working for organizations, the American Enterprise Institute and Manhattan Institute, respectively, that have taken money from both Exxon and the Koch brothers. And yet both men are full-throated advocates for what Bryce calls "N2N" — accelerating the transition from coal to natural gas and then to nuclear.
Arguably, the climate-energy paradox is a bigger problem for the Left than the Right. One cannot logically claim that carbon emissions pose a catastrophic threat to human civilization and then oppose the only two technologies capable of immediately and significantly reducing them. And yet this is precisely the position of Al Gore, Bill McKibben, the Sierra Club, NRDC, and the bulk of the environmental movement.
By contrast, there are plenty of good reasons for climate skeptics to support N2N. A diverse portfolio of energy sources that are cheap, abundant, reliable, and increasingly clean is good for the economy and strengthens national security - all the more so in a world where energy demand will likely quadruple by the end of the century.
Why then is there so much climate skepticism on the Right? One obvious reason is that climate science has long been deployed by liberals and environmentalists to argue not only for their preferred energy technologies but also for sweeping new regulatory powers for the federal government and the United Nations.
But here as well, the green agenda hasn’t fared well. Those nations that most rapidly reduced the carbon intensity of their economies over the last 40 years did so neither through regulations nor international agreements. Nations like France and Sweden, which President Obama rightly singled out for praise earlier this month, did so by directly deploying nuclear and hydroelectric power. Now the United States is the global climate leader, despite having neither a carbon price nor emissions trading, thanks to 35 years of public-private investment leading to the shale gas revolution. Meanwhile, there is little evidence that caps and carbon taxes have had much impact on emissions anywhere.
In the end, both Left and Right reject a more pragmatic approach to the climate issue out of fear that doing so might conflict with their idealized visions for the future. Conservatives embrace N2N as a laissez-faire outcome of the free market in the face of overwhelming evidence that neither nuclear nor gas would be viable today had it not been for substantial taxpayer support. Progressives seized on global warming as an existential threat to human civilization because they believed it justified a transition to the energy technologies – decentralized renewables – that they have wanted since the sixties.
The Left, in these ways, has been every bit as guilty as the Right of engaging in "post-truth" climate politics. Consider New Yorker writer Ryan Lizza's glowing profile of Tom Steyer, the billionaire bankrolling the anti-Keystone campaign. After Lizza suggested that Steyer and his brother Tom might be the Koch brothers of environmentalism, Steyer objects. The difference, he insists, is that while the Koch brothers are after profit, he is trying to save the world.
It is telling that neither Lizza nor his editors felt it necessary to point out that Steyer is a major investor in renewables and stands to profit from his political advocacy as well. Clearly, Steyer is also motivated by green ideology. But it is hard to argue that the Koch brothers haven’t been equally motivated by their libertarian ideology. The two have funded libertarian causes since the 1970s and, notably, were among the minority of major energy interests who opposed cap and trade. Fossil energy interests concerned about protecting their profits, including the country's two largest coal utilities, mostly chose to game the proposed emissions trading system rather than oppose it as the Koch brothers did.
As Kathleen Higgins argues in a new essay for Breakthrough Journal, it's high time for progressives to get back in touch with the liberal tradition of tolerance, and pluralism. "Progressives seeking to govern and change society," she writes, should attempt to "see the world from the standpoint of their fiercest opponents. Taking multiple perspectives into account might alert us to more sites of possible intervention and prime us for creative formulations of alternative possibilities for concerted responses to our problems."
As Left and Right spend the next week slugging it out over what the climate science does or does not tell us, we would do well to remember that science cannot tell us what to do. Making decisions in a democracy requires understanding and tolerating, not attacking and demonizing, values and viewpoints different from our own.
Conservatives have important things to say when it comes to energy, whether or not they think of it as climate policy. Liberals would do well to start listening.
In December 2010, Meredith Whitney, the financial analyst, appeared on 60 Minutes, where she predicted that the United States would see between 50 and 100 defaults of municipal bonds. Since she was one of the earliest analysts to predict the financial meltdown, publishing a research report in October 2007 that said that because of mortgage losses Citigroup might have to cut its dividend, it was not surprising that her statement attracted a great deal of attention, but also significant pushback from industry representatives, who insisted that municipal bonds were safe. This book, "Fate of the States: The New Geography of American Prosperity" is her effort to elaborate on that call.
Whitney begins her analysis with a review of the housing bubble and banking crisis, which by now is well trod ground, but she does so in a highly informed and balanced way. Where some commentators want to place most of the blame on government, others on Wall Street, and yet others on the Federal Reserve Bank for keeping interest rates too low for too long, she argues that everyone behaved badly. The self-destructive behavior that she witnessed on the part of many banks and financial institutions during this period remains an enduring and puzzling part of the story.
Readers of New Geography will be familiar with two of the themes that she articulates. One is the rise of a zone of prosperity from the Gulf Coast through the heartland and up to North Dakota that has been built on pro-active energy policy and strong global demand for agricultural commodities. A second theme she articulates is the striking disparity in the cost of living between states like California and New Jersey compared with far more affordable states like Texas. Low cost states, she says, will continue to attract new investment and jobs.
In arguably the core section of the book, she explains how the housing bubble interacted with banking and government to create what she calls “The Negative Feedback Loop from Hell.” By way of background, it should be noted that the underlying economics of banking are unusual. As economist Joseph Stiglitz demonstrated in the 1980s, the price of money does not necessarily clear markets. Instead, banks often employ credit rationing in order to control risk. As she argues, this is exactly what happened in the states where the housing bubble inflated the most. These are the states where the subsequent economic decline was the greatest.
As Whitney shows, it was also these states, where government officials handed out the most generous pay packages, including large back loaded pensions. On top of that, these states often piled on the most government debt, which nearly doubled between 2000 and 2010. The result has been significant retrenchment on core government services, from police and fire protection to public education. In her view, this is the negative feedback loop from hell, and the reason that she believes that fiscal stress will continue for a long period of time.
As the fight for limited resources works itself out, she believes that besides government there will be three parties at the negotiating table. Two are straightforward enough: the bondholders, who expect to be paid back the money they lent, and the public sector employees, who expect to receive the pensions they were promised. But she also sees a third party. Writing shortly before the bankruptcy in Detroit, she presciently recognized that citizens will also have a claim on resources, arguing that they need and deserve the services that government is supposed to provide.
Although the sub title of the book mentions geography, Whitney largely dismisses what a contemporary textbook on economics and geography calls the “who, why, and where of the location of economic activity.” This is not surprising. There are probably few people who are aware that this branch of economics even exists. (Among professional economists, more attention has been paid in recent years with the advent of New Economic Geography as championed by Paul Krugman, although, ironically, empirical research indicates that key elements of of Krugman’s theoretical work are almost certainly wrong.)
While Whitney rightly focuses on the economic growth that distinguishes many of the states in the central corridor of the country, she cites data that shows that most economic activity continues to occur elsewhere. She observes, “These so-called flyover states contributed 25 percent of U.S. GDP in 2011, up from 23 percent in 1999.” That is nearly a 10 percent increase, but obviously from a lower base. A current and highly visible example of the importance of geography is the huge growth in the number of warehouses along the New Jersey Turnpike, as engineering projects deepen New York harbor and expand the Panama Canal. Access to water will always be important.
Additionally, I would argue that the issues that Whitney addresses cannot be fully understood without taking into account the challenges that continue to face older industrial cities. All economies must constantly re-invent themselves. In the case of cities with a large industrial legacy, however, intrinsic market failures caused by asymmetric and imperfect information have made redevelopment significantly more difficult. Theoretical and empirical work in recent years has also shown that joint and several liability under U.S. environmental law undermines efficient price discovery for properties that once had an industrial use.
These issues aside, Whitney has written a book that is both provocative and necessary. Clearly, certain states have instituted policies that are far more effective at attracting business and new residents. At the same time, other states appear unable to reform. Perhaps her central insight is that problems associated with debt can take on a life of their own. Therefore, her message is clear. States that properly manage their debt and pension obligations will enjoy a prosperous future. States that do not will encounter severe problems. Investors and public sector employees take note.
Eamon Moynihan is the Managing Director for Public Policy at EcoMax Holdings, a specialty finance company that focuses on the redevelopment of previously used properties.
Statistics Canada’s newly released National Household Survey indicates changes in the distribution of median household incomes among the provinces and territories. The new data is for 2010, and indicates that an increase of 13.9 percent per household at the national level from the 2005 data collected in the 2006 census.
The big story, however, is the progress in parts of Canada that have grown used to laggard economic performance. In 2005, few would have expected the progress made in the provinces of Saskatchewan and Newfoundland & Labrador. In both cases, the resource boom had much to do with the turnaround.
Gains in Saskatchewan and the Prairies
Saskatchewan’s median household income grew 32.1 percent, out-distancing perennial champion Alberta and emerging Newfoundland & Labrador by nearly a third (Figure). Alberta’s income was up 22.9 percent, while Newfoundland & Labrador experienced a nearly as great 22.7 percent increase. Saskatchewan had trailed British Columbia by more than 10 percent five years before, but had edged ahead by 2010. Saskatchewan’s income level now leads all of the provinces except Alberta and Ontario.
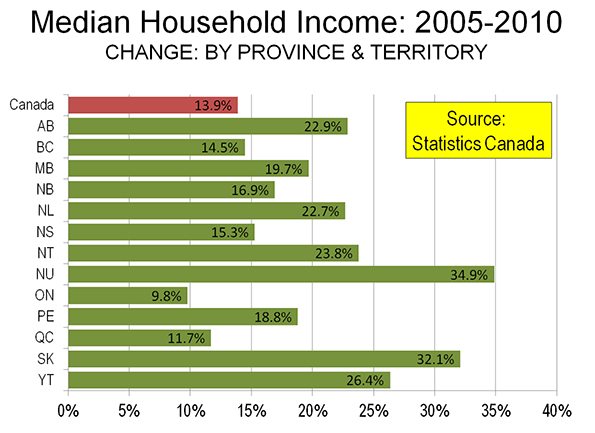
All three of the Prairie Provinces did well. In addition to Saskatchewan and Alberta, household income in Manitoba grew at a 20 percent, stronger than all provinces outside the prairies except for Newfoundland & Labrador.
A New Day in Newfoundland and Labrador
While Saskatchewan has experienced prosperity from time to time in its history, the same is not so true in Newfoundland and Labrador. In fact, in 1933, the government of Newfoundland (as it was then known) voted itself out of existence as a Dominion of the British Empire because of its serious financial difficulties. Effectively, the Dominion was relegated to the status of a British crown colony (like former Hong Kong). Newfoundland joined Canada as the 10th province in 1949. With that, representative government was restored, but Newfoundland always lagged behind (generally along with the Maritime provinces of New Brunswick, Nova Scotia and Prince Edward Island). In 2005, Newfoundland and Labrador ranked 10th out of the 10 provinces in median household income. By 2010, the ranking had improved to 7th.
The Prosperous Territories
The greatest income growth (35 percent) was in the territory of Nunavut, which was created by carving out the eastern portion of the Northwest Territories in 1999. Nunavut covers a land area about 1.3 times that of Alaska, but has only 30,000 residents (about the same as live in a square kilometer of Manhattan or Paris). The Yukon experienced a 26 percent increase, while the Northwest Territories had a 24 percent increase. The Yukon and the Northwest Territories had stronger income growth than all of the provinces, except Saskatchewan.
The Old Dynamos Trail
Meanwhile, the economic dynamo of the nation, Ontario experienced household income growth of less than 10 percent, nearly a third less than the national average, and less than one-third of Saskatchewan. Ontario is home to more than one-third of the national population. British Columbia, which has historically experienced strong economic growth, could muster only slightly above average household income growth (14.4 percent compared to the national 13.9 percent).
This may be a surprising headline to readers of The Wall Street Journal and the Washington Post, which reported virtually the opposite result in their August 19 editions. The stories, “Hip, Urban, Middle-Aged: Baby boomers are moving into trendy urban neighborhoods, but young residents aren't always thrilled,” by Nancy Keates in The Wall Street Journal and “With the kids gone, aging Baby Boomers opt for city life,” by Tara Barampour in the Washington Post reported on information from the real estate firm, Redfin (a link to the corrected Wall Street Journal story is below). Both stories reported virtually the same thing: that 1,000,000 baby boomers moved to within five miles of the city centers of the 50 largest cities between 2000 and 2010. Because these results appeared to be virtually the opposite of census results, I contacted both papers seeking corrections.
When pressed for more information, Redfin.com responded with a tweet indicating that: “We don't have a link to share or published study; Redfin did a special analysis of Census data at reporters' requests.”
In fact, the census data shows virtually opposite. Redfin’s method was not clear, so I queried the five mile radius within the main downtown areas of the 51 metropolitan areas with more than 1,000,000 population in 2010, shown below in this table and figure.
Within the five mile radius of downtown, there was a net loss of 1,000,000 baby boomers, or 2 percent of the 2000 population (ages 35 to 55 in 2000). There was also a loss of 800,000 in the suburbs, or 17 percent of the 2000 population. The continuing dispersion of the nation is indicated by the fact that there was a gain of nearly 450,000 in this cohort outside the major metropolitan areas. Overall, there was a net loss of 1.3 million, principally due to deaths.
To its credit, The Wall Street Journal issued a correction, as I would have expected. The incorrect reference to an increase of baby boomers in the urban cores was removed. To my surprise, not only did the Washington Post fail to make a correction, but they also ignored multiple requests to deal with the issue (though my emails received courteous computer generated acknowledgements).
With the ongoing repetition of the “return to the city from the suburbs” myth, it is important to draw conclusions from the data, not from impressions.
An article by Nancy Keates in today’s The Wall Street Journal indicates that more than 1,000,000 baby boomers moved to within the downtowns of the 50 largest cities between 2000 and 2010. The article quoted Redfin.com as the source for the claim.
In fact, the authoritative source for such information is the United States Census. The Journal’s claim is at significant variance with Census data.
First of all, according to US Census Bureau data, the areas within 5 miles of the urban cores of the 51 metropolitan areas with more than 1,000,000 population lost 66,000 residents between 2000 and 2010 (See Flocking Elsewhere: The Downtown Growth Story). It is implausible for 1,000,000 boomers to have moved into areas that lost 66,000 residents (Figure).
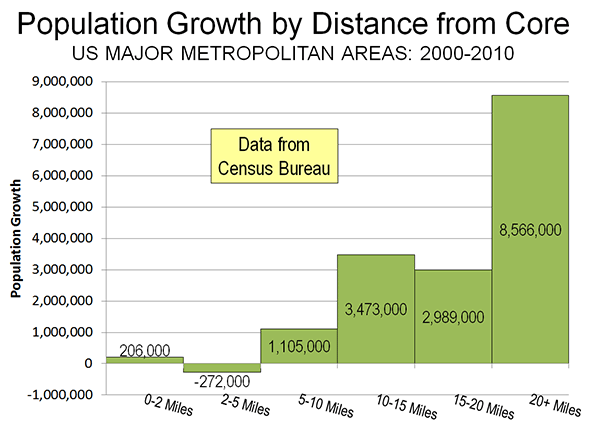
Secondly rather than flock to the city, as the Journal insists, baby boomers continued to disperse away from core cities between 2000 and 2010, as is indicated by data from the two censuses. The share of boomers living in core cities declined 10 percent. This is the equivalent of a reduction of 1.2 million at the 2010 population level (Note). The share of the baby boomer population rose 0.5 percent in the suburbs, the equivalent of 175,000. Outside these major metropolitan areas, the share of baby boomers rose three percent, which is the equivalent of 1,050,000. All of the net increase in boomers , then, was in the suburbs or outside the major metropolitan areas, while all of the loss was in the core cities.
Among the 51 major metropolitan areas, only seven core cities gained baby boomers (See table at Demographia.). Among these seven, only two had larger percentage gains than the suburbs in the same metropolitan areas. One of these was Louisville, which accomplished the feat by a merger with Jefferson County. Louisville’s gain appears to have been simply the result of moving boundaries, not moving people.
Note: The age groups used are 35 to 55 in 2000 and 45 to 65 in 2010, which approximate the baby boomers. There was a decline in the number of baby boomers between 2000 and 2010 (largely due to deaths). The figures quoted in this article allocate the same percentage loss from this reduction to the 2000 baby boomer population for each core city and metropolitan area (the national rate).
When Rahm Emanuel was Barack Obama’s Chief of Staff, little did he know he’d be helping craft a law that would help him as the future Mayor of Chicago. Many American cities failed to put away enough money for current and former government workers. Rahm Emanuel and powerful Democratic Party interest groups would like the federal government to bailout their pensioners. While the unions are less shy about looting federal taxpayers, Emanuel is working hard getting federal help.
Emanuel needs to cut costs immediately to prevent more downgrades from the bond rating agencies. One of Emanuel’s creative financial techniques involves the use of Obamacare as way of pushing some financial costs from the city of Chicago budget onto the federal government. Many retired workers don’t like or want Obamacare. The Chicago Sun Times reports :
Chicago’s 30,000 retired city employees are trying to stop Mayor Rahm Emanuel from saving $108.7 million — by phasing out the city’s 55 percent subsidy for retiree health care and foisting Obamacare on them.
One week after an unprecedented, triple-drop in Chicago’s bond rating, retirees have filed a class-action lawsuit against the city and its four employee pension funds that threatens to make the financial crisis even worse.
The suit argues that the Illinois Constitution guarantees that municipal pension membership benefits are an “enforceable contractual relationship which may not be diminished or impaired.”
Chicago’s retired workers aren’t the only individuals unhappy with Obamacare. IRS workers don't want Obamacare but likely will find they can’t keep their current health insurance. All of this is providing massive strains on the Blue Model coalition of government workers and the Democratic Party. In Chicago, at least retired government workers can know who to blame for their change in health insurance if they lose their lawsuit. Mayor Rahm Emanuel not only was instrumental in getting Obamacare passed but now he’s dumping Obamacare on thousands of workers as Chicago’s Chief Executive.
For more than a quarter century, the leaders in the Oregon portion of the Portland metropolitan area have sought to transfer demand for urban travel from automobiles to transit. Six rail lines have been built, five of which are light rail and bus service has been expanded. If their vision were legitimate, transit’s market share should have risen substantially and automobile travel should have declined. Neither happened.
The results have been modest, to say the least. Since 1980, before the first rail line was opened, transit’s share of work trip travel in the metropolitan area has declined by one-quarter, from 8.4 percent to 6.3 percent. Overall, the share of travel by car remains about the same as before the first light rail line opened (based upon data from the Texas Transportation Institute and the Federal Transit Administration).
Transit access to destinations outside downtown Portland remains scant. Despite the huge expenditures on transit, only 8 percent of the jobs in the metropolitan area can be reached by the average employee in 45 minutes, despite the fact that nearly 85 percent of workers are within walking distance of the transit stops or stations. Portland’s transit access is better than the national major metropolitan average of six percent. But Portland trails a number of other metropolitan areas and is well behind the best, Milwaukee, Wisconsin, which has a transit access figure of only 14 percent. This makes a mockery of the “transit access” measure used by many planning agencies. Being close to a transit stop or station is of little help if service to the desired destination is not available or takes too much time.
According to the latest American Community Survey data, the average work trip by people driving alone in Portland is 23.6 minutes, while the average transit commute trip is 43.8 minutes.
Further, Portland transit users could face draconian service reductions. Tri-Met, which operates light rail and most Oregon services, has warned that it may be required eventually to cut 70 percent of its service. This results from the failure to control labor costs, particularly pension costs, which is detailed in an Oregonian article. John Charles, president of the Cascade Policy Institute found that $1.63 all the benefits were being paid out for every dollar of wages, a claim confirmed by PolitiFact. The concern extends to the state capital, where the legislature has overwhelmingly approved a bill requiring an audit of Tri-Met by the Secretary of State.
Tri-Met continues to expand light rail, but with some “pushback.” An under-construction line to Milwaukie evoked such controversy in Clackamas County, that voters elected an anti-light rail majority to the county commission. Voters have banned light rail expenditures without a public vote in the suburban municipalities of Tigard and King City. Clark County (Washington), voters rejected funding for a light rail connection to the Portland system. This opposition was at the heart of defunding a replacement Interstate 5 bridge over the Columbia River. The project recently closed after spending $175 million (see Project Closing Notice).
With the investment and expansions, these should have been the halcyon days of transit in Portland. The future could be even more challenging.
|


