NewGeography.com blogs

The Precarious State of the Highway Trust Fund

On November 18, President Obama signed into law a bundle of appropriation bills for FY 2012  including appropriations  for the U.S. Department of Transportation. The measure had been passed earlier in the House by a vote of 298-121 and in  the Senate by a vote of 70-30. 

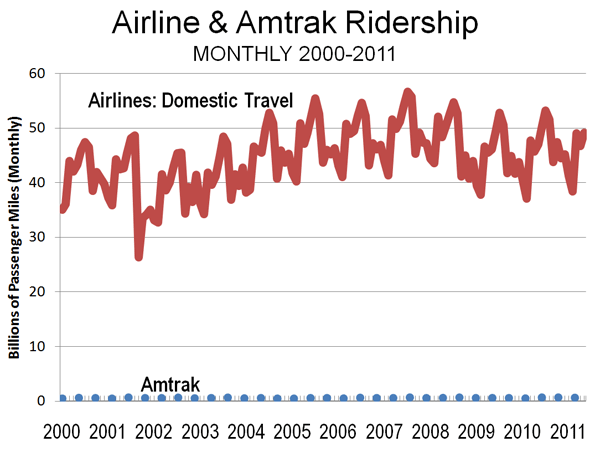
The bill provides $39.14 billion in obligation limitation for the highway program, a reduction of almost $2 billion from FY 2011; however, an additional $1.66 billion is appropriated for highway-related "emergency relief." The transit program is funded at $10.31 billion (incl. $1.95 for New Starts), a $400 million increase from FY 2011, and Amtrak at $1.42 (incl. $466 million for operating expenses). The discretionary TIGER program is retained at $500 million, a slight decrease from FY 2011.

Conspicuously absent in the new budget is any funding for high-speed rail and the Intercity Passenger Rail Service program --- a fact cheered  by fiscal conservatives but mourned by boosters of high-speed rail and supporters of the California bullet train. The California High-Speed Rail Authority relies heavily on further federal funds to complete the project. According to its business plan, it expects $33-36 billion to come from the federal government. Failure by Congress to appropriate money for high-speed rail for a second year in a row makes the prospect of future federal support for the California rail project increasingly doubtful. 

Also refused any funding in the FY 2012 congressional transportation appropriation are two other Administration priorities:  the Livable Communities Initiative ($10 million requested in the President's budget); and the National Infrastructure Bank ($5 billion requested).  The conference committee action would seem to put an effective end to any further attempts to create the Bank, at least during the remainder of this session of Congress.      

Solvency of the Highway Trust Fund in Jeopardy
The congressional conferees have warned that the bill will deplete almost all resources from the Highway Trust Fund (HTF) by the end of fiscal year 2012.   "Without enactment of a new surface transportation authorization bill with large amounts of additional revenues this year," the report said, "the Highway Trust Fund will be unable to support a highway program in fiscal year 2013. The conferees strongly urge the committees of jurisdiction to enact surface transportation legislation that provides substantial long-term funding to continue the federal-aid highways program."

As Taxpayers for Common Sense (TCS) pointed out in a commentary, the appropriations committee is willing to acknowledge the problem, but quickly passes the buck to the authorizers to come up with more cash for future years.  But the authorizers aren't doing any better. The Senate Environment and Public Works (EPW) Committee passed a $109 billion reauthorization bill that would fund two years of transportation spending by essentially drawing the HTF balance down to zero (and still unable to identify the remaining  $12 billion in offsets). To House Transportation and Infrastructure Committee Chairman John Mica (R-FL) the implications of the Senate action are clear.  In a November 14 letter to Senate EPW Committee Chairman Barbara Boxer (D-CA)  he warns that the Senate bill will "essentially bankrupt the Highway Trust Fund and make it impossible to provide any funding for fiscal year 2014."

To its credit, the Senate Environment and Public Works Committee recognized the precarious state of the Trust Fund and took steps to impose spending controls to prevent the Fund from falling into insolvency.  The Senate bill provides (in section 4001) for mandatory reductions in the obligation limitation should the Trust Fund  balances in the Highway Account, as estimated by the CBO, fall below a certain pre-determined level (for example, in the event gas tax revenues fail to match expectations). The designated triggers are $2 billion at the end of FY 2012 and $1 billion at the end of FY 2013. In other words, the Senate EPW committee has wisely provided for a mechanism to reduce highway expenditures below the authorized  $109 billion level in order to prevent the Trust Fund from going bankrupt.

The House, for its part, is exploring a different way to fund a longer-term, five-year reauthorization. On November 17, Speaker Boehner announced he will unveil in December a combined transportation and energy bill, dubbed the "American Energy & Infrastructure Jobs Act,"  (HR 7). The bill  would authorize expanded offshore gas and oil exploration and dedicate royalties from such exploration to "infrastructure repair and improvement" focused on roads and bridges. 

However, many questions have been raised about this approach. Several lawmakers ---  notably, Rep. Nick Rahall (D-WV), Ranking Member of the House Transportation and Infrastructure Committee, Sen Barbara Boxer (D-CA) chairman of  of the Senate Environment and Public Works Committee  and Sen. James Inhofe (R-OK) the committee's ranking member---have criticized the aproach as problematical and potentially miring the bill in controversy. They allege that  the royalties the House is counting upon would fall billions of dollars short of filling the gap in needed revenue  (the gap is estimated at approximately $75-80 billion over five years). They further allege that the revenue stream from the royalties would not be available in time to fund the measure. 

Other critics have pointed out that states in whose jurisdiction drilling may occur, will assert a claim to a lion portion of the royalties. Also, using oil royalties to pay for transportation would essentially destroy the principle of a trust fund supported by highway user fees.  For all the above reasons, the House proposal is likely to meet with a skeptical reception in the Senate.

As the TCS memorandum aptly concluded,  in the end it's a big game of "kick the can." The appropriators kick the can to the authorizers. The authorizers kick the can down the road a couple of years or rely on speculative and uncertain revenue that may or may not materialize. In the meantime, the fate of the Trust Fund continues to hang in a precarious balance, victim of Congressional indecision and new fiscal imperatives.    
 
~~~~~~~~~~~~~~~~~~~~
Note: the NewsBriefs can also be accessed at www.infrastructureUSA.org

A listing of all recent NewsBriefs can be found at www.innobriefs.com

Population Growth in Australia Has Normalized

Yesterday’s Daily Telegraph contained an interesting article on the increasing number of Australians departing Australia permanently:

OVERALL migration from Australia has soared to a record high – with 88,000 leaving in the past year, almost half from NSW.

The stampede abroad is a 90 per cent increase 10 years ago, figures from the Department of Immigration show.

Half the emigrants are Australian-born who have chosen to start new lives in Britain (15,119), New Zealand, (14,596), the US (8046 and Singapore (6952)…

At the same time, the number of people emigrating to Australia has dropped, by 9 per cent to 127,458 in the past year, making the ratio of departures to arrivals a record high…

Upon reading this article, I decided to crunch the numbers to determine how Australia’s migration numbers are tracking. The below chart shows the permanent arrivals vs permanent departures numbers alluded to in the above article. The ratio of arrivals to departures is also shown:


As you can see, the number of net permanent arrivals into Australia – around 45,000 for the 12 months to September 2011 – is well below the long-run average (around 65,000). The ratio of arrivals to departures is also in long-term decline and currently sits at a 35-year low of 1.5 times.

However, the broader net overseas migration (NOM) statistics published by the Australian Bureau of Statistics, which measures in/out migration of anyone residing/leaving Australia for a period of 12 months or more (rather than permanently), paints a different picture.

According to these statistics, NOM is still above long-term trends, but has declined sharply from the peak level seen in the year to September 2008, from around 315,000 to 170,000:


With the decline in NOM, Australia’s population growth has also fallen significantly, from a peak of just under 470,000 in the year to September 2008 to just under 320,000. The share of population growth coming from immigration has also fallen over the same period from a peak of 67% to 54%.


Finally, in percentage terms, it appears that Australia’s population growth and immigration are returning to average levels after surging in the 3 years to 2008:


With the ABS scheduled to release the June quarter NOM data in mid-December, it will be interesting to see whether Australia’s NOM mirrors the permanent arrivals/departures figures and registers another fall.

This piece originally appeared at Macrobusiness.

Leith van Onselen writes daily as the Unconventional Economist at MacroBusiness Australia. He has held positions at the Australian Treasury, Victorian Treasury and currently works at a leading financial services company. Follow him @leithVO.

California's Bullet Train in the Court of Public Opinion

A business plan released on November 1 by the the California High-Speed Rail Authority (CHSRA), has placed the price tag for the LA-SF bullet train project at $98 billion--- trippling the $33 billion estimate provided in 2008 in the voter-approved Proposition 1A. At the same time, the date of project completion has been pushed back by 13 years -- from 2020 to 2033.

California state legislators who must soon decide whether to proceed with the high-speed rail project are facing an increasingly skeptical climate of opinion.  A growing body of their colleagues who formerly supported the rail authority, including state Senators Alan Lowenthal, Joe Simitian and Mark DeSaulnier, have been shocked by the new estimate and have begun to question the wisdom of proceeding with the project. Other legislators intend to go further. State Sen. Doug LaMalfa said he will sponsor a bill to put the voter-approved rail project back on the ballot. House Majority Whip Kevin McCarthy announced that he will introduce legislation that would freeze federal funding for the project for one year so that congressional auditors can review its viability.

At the federal level, chances of further funding for the California project are judged to be negligible, with Congress having virtually zeroed out high-speed rail funds in the FY 2012 federal budget.

At the same time, the bullet train is rapidly losing public support. Nearly two-thirds of California's likely voters would, if given a chance, stop the project according to a recent opinion survey. Organized opposition within the state is widespread. Public interest groups and watchdog coalitions such as  Californians Advocating Responsible Rail Design (CARRD), the Community Coalition on High-Speed Rail, the California Rail Foundation, and the Planning and Conservation League have repeatedly challenged the Authority's cost estimates, ridership projections and rail alignments. They have testified against the project in public hearings and taken the Authority to court. Recently, they scored a legal victory when a state judge ruled that the Authority has to reopen and revise its environmental analysis of a controversial alignment.

A team of respected independent experts, comprising Stanford economist Alain Enthoven, former World Bank analyst William Grindley and financial consultant William Warren, have reinforced the growing feeling of doubt about the project's viability by challenging the rail authority's assumptions and pointing out the flaws in its business  plan. 

Finally, at both the national and state levels, the bullet train project is receiving an increasingly skeptical press scrutiny. Nearly every newspaper in the state (with the exception of the LA Times and SF Chronicle) has turned critical.  News services, notably California Watch (founded by the Center for Investigative Reporting) and investigative reporters, such as SF Examiner's Kathy Hamilton, Mercury News' Mike Rosenberg and OC Register's Steve Greenhut are providing incisive critical analysis to counter the steady flow of publicity generated by the Authority and its supporters. 

Critical commentaries in mainstream press vastly outnumber favorable stories. Here are three examples:

The Train to Neverland
The Wall Street Journal , November 12, 2011

California's high-speed rail system is going nowhere fast
The Washington Post, November 13, 2011

High-Speed rail depends on $55B in federal funds
California Watch, November 12, 2011 (by Ron Campbell and Lance Williams)


Ken Orski has worked professionally in the field of transportation for over 30 years.

~~~~~~~~~~~~~~~~~~~~
Note: the NewsBriefs can also be accessed at www.infrastructureUSA.org
A listing of all recent NewsBriefs can be found at www.innobriefs.com

How Phoenix Housing Boomed and Busted

When analysing the US housing bubble, four states stand-out for the way in which home values rose into the stratosphere before crashing and burning: California, Nevada, Florida and Arizona (see below chart).


Since I covered three markets were covered in previous posts at Macrobusiness (see above links), I now want to analyse the Arizona housing market – with particular emphasis on its largest city, Phoenix – to determine why prices bubbled and then burst in such a violent manner.

In the lead-up to the crash, Phoenix’s economy was booming. New jobs were being added at a fast pace and per capita incomes were growing strongly:


With confidence riding high on the back of seemingly solid fundamentals and rising asset prices, along with easy access to credit, Arizona households borrowed heavily. Per capita debt accumulation surged in the mid-2000s to levels far in excess of the national average:


But Phoenix was living on borrowed time. With the national economy turning south in the wake of the sub-prime crisis and the collapse of Lehman Brothers, Phoenix home prices, which had already been falling gradually, began to slide fast. After home prices peaked in May 2006, it took another 18 months before Phoenix’s unemployment rate began rising:


The rest is history. Home prices continued falling, unemployment kept rising, and nominal per capita incomes fell for the first time in at least 40 years.

And the pain is widespread, with around one in seven mortgages 90 days in arrears – well in excess of the national average:


So what went wrong? Could anything have been done differently to prevent the housing bubble/bust?

Certainly, if credit was less readily available, households would have been constrained in their ability to bid-up prices. But easy credit was only part of the problem. Another key driver of the rampant price escalation and then collapse was the way in which land was supplied for housing.

Throughout the 2000s, Arizona was one of the fastest growing metropolitan area in the United States with more than 1,000,000 population (see below chart).


However, despite there being ample developable land on the urban fringe to accomodate this population growth, the actual quantity of land available for development was heavily restricted on two counts:

  1. The State of Arizona passed statewide planning laws in 1998 and 2000, which included the implementation of high impact fees on new development and urban containment devices. In a 2006 study of land-use policies in the 50 largest metropolitan areas of the US, the Brookings Institution ranked Phoenix as ‘growth management’, which is the same ranking as Florida and California.
  2. The overwhelming majority of potential developable land in Arizona is either owned by the state and federal governments, preserved for conservation, or otherwise off-limits to development.

On the second point – the lack of available land for development – the below graphics highlight the land supply situation in Phoenix.

First, a pie diagram, extracted from the Arizona State Land Department Annual Report, showing how only 17.5% of land in Arizona is privately owned:


Second, a map showing the lack of developable land around Phoenix:


There is evidence that the Arizona State Land Department, whose mission is to “optimize economic return for the Trust beneficiaries”, heavily restricted sales of land to the market in an effort to maximise revenues, causing builders and developers to bid-up land price in period auctions to ensure their supply of land for construction (called ‘land banking’).

Whereas the price of land for housing sold for around $40,000 per acre immediately prior to the bubble, at the peak average land prices fetched nearly $200,000 (see below chart).


And with the state rationing the supply of fringe land, average residential land prices rose throughout Arizona:


Obviously, this land price inflation was a principal cause of the house price escalation as well as the delayed supply response to the rapidly growing population and rising house prices (see below chart).


Had land around Phoenix been freely available for development, developers would likely not have paid such high prices for the land sold by the state government and Phoenix home prices would never have risen to such heights or crashed as violently.

Phoenix is yet another example of where excessive government interference in the supply of land has combined with easy credit to create a speculative bubble followed by a painful bust.

This piece originally appeared at Macrobusiness.

Leith van Onselen writes daily as the Unconventional Economist at MacroBusiness Australia. He has held positions at the Australian Treasury, Victorian Treasury and currently works at a leading financial services company. Follow him @leithVO.

If Wishes Were Iron Horses: Amtrak Gaining Airline Riders?

Andy Kunz of the U.S. High Speed Rail Association commented to Fox Business News on the recently announced record ridership on Amtrak that, "At the very least, the increased demand offers another sign travelers are getting fed up with soaring airline fares and fight cancellations."  In the article, which read more like an Amtrak or high speed rail press release than a news story, reporter Jennifer Booton made what Gulliver, in The Economist, called "a fairly convincing argument that Americans are turning to trains as an alternative to driving and air travel." The Economist should have known better.

Yes, Amtrak ridership is up and airline patronage has been up and down in recent years. But, trains as an alternative to air travel? In fact, Amtrak's ridership is so small that distinguishing between the bottom of the graph below and the Amtrak ridership is difficult (see Figure). While Amtrak ridership rose five percent last year, the same number of new airline passengers would have constituted only 0.06 percent increase (or nearly 1/100th the impact on Amtrak). Amtrak's ridership is so low that the monthly change (increase or decrease) in airline patronage has exceeded  total 2011 Amtrak ridership in 120 of the last 125 months.

Booton and Gulliver may imagine business travelers abandoning frequent airline service to board trains slower than cars that run once daily. Or perhaps they imagine faux-high speed rail service that will still be too slow or too infrequent. Airline executives aren't losing sleep over potential losses to trains.

All in the Family, 2011

We overheard this phone conversation recently between tea party activist Bill Francis and his 19-year-old daughter and Wall Street occupier Serena: 

Bill:  I understand why you’re protesting but I think you’re missing the point.

Serena:  What’s that?

Bill:  You’re mad at rich people and upset that you can’t get a job.

Serena:  True.

Bill: And you think that by camping out on the street you’ll get attention?

Serena: We’ve already made a difference.

Bill: Tell me how?

Serena: The media is talking about our issues.

Bill: They’re just using you.

Serena:  So what.

Bill: Liberals like the idea of class warfare.

Serena:  You used the media.

Bill:  We knew what we were doing.

Serena: You were rude.

Bill:  We made our point.

Serena: You called Obama a socialist.

Bill: He is.

Serena:  What do you mean by that?

Bill: He wants the government to run our lives.

Serena: Who do you think is running your life now?

Bill: That’s the point.  We want to control our own lives.  That’s what being an American means.

Serena: I think the corporations are in charge and you don’t even realize it.

Bill: Listen, honey, I can ignore the corporations – I don’t have to buy what they sell.  I can work for anyone I choose.

Serena: You’re not facing facts.  Corporations and banks are telling politicians what to do.  And they’re moving jobs to other countries.

Bill: That’s because of taxes.

Serena:  What’s because of taxes?

Bill: Jobs leaving the country.

Serena: Dad, they barely pay any taxes.

Bill: The point is that they’re free to do business wherever they want.

Serena: You don’t want to see how much power they have over us.

Bill: I agree there’s corruption.

Serena: And greed.

Bill:  That’s human nature.

Serena:  Now you’re going to tell me that corporations are people.

Bill: I just don’t like that you’re sleeping in a tent every night, that’s all.

Serena:  Don’t worry Dad, I’m safe.  You taught me to take care of myself.

Bill: I still don’t understand what you’re trying to accomplish.

Serena:  We’ll figure it out as we go.

Bill: But, anyway, as long as you’re coming home to take showers and wash your clothes, I suppose it’s o.k.

Serena: Got to go.  Love you dad.

Bill: Love you too honey.

This first appeared at LaborLou.com.

Interactive Data Visualization: The Connection Between Manufacturing Jobs and Exports

By Hank Robison and Rob Sentz

We recently observed that there are only about 50 manufacturing sectors out of 472 (6-digit NAICS) that actually gained jobs over the past 10 years. This made us wonder because we keep hearing that manufacturing output is actually improving. Politicians and policymakers tend to assume that an uptick in output would naturally result in an uptick in employment. So we investigated.

What we found

We placed national export data on top of job totals for each of the 472 manufacturing sectors, and found that manufacturing exports (inflation-adjusted) actually grew by 56% from 02-10 while manufacturing jobs contracted by 23%. Growth in exports have clearly not resulted in more domestic jobs. See the interactive graphic at the bottom of this post for a visualization.

Across the manufacturing sectors we are actually seeing a predominantly inverse relationship between jobs and exports. To explore this further, we placed each of the 472 industries into one of four categories (again see the graphic):
1) Those that gained both exports and jobs,
2) Those that gained exports but lost jobs,
3) Those that lost exports but gained jobs, and
4) Those that lost both exports and jobs.

Some observations

Those advocating for increased exports as a way of resuscitating jobs in manufacturing need to look at this data. Only 11% of all manufacturing sectors showed gains in jobs and exports, which is not a huge surprise given manufacturing decline. 19% lost jobs AND exports at the same time. Now here is the stat really worth noting — 71% of all manufacturing sectors increased their exports while decreasing their domestic workforce.

There are some political ramifications here. The Obama Administration has proposed exports as a key to kick-starting the U.S. labor market (see this post from Brookings). Economists and policy experts as well as all of us here at EMSI are huge fans of improving exports. Exports are a principal source of foreign exchange and an important driver for U.S. goods. Export industries also tend to pay higher wages and connect with the rest of the economy through greater multiplier effects, which mean they are key for income and job formation.

However, as the data suggests things are not that simple. Domestic manufacturers appear to be outsourcing large parts of their work to foreign suppliers. In the process, they employ fewer domestic workers but become more competitive in foreign markets. As a result, exports go up while employment goes down. This is something that policymakers need to consider before pinning too much hope on exports as a way of reviving manufacturing sector employment.

Conclusion

There may be a conflict of goals here. On one hand we want high-wage, high-benefit jobs; on the other, “full employment.” But in manufacturing can we have both? If wages, and benefits are pushing producers to outsource then either wages go down (an unattractive prospect), or we adopt policies that spawn productivity growth needed to support high-wages. Are there any other choices?

Data Graphic

In this interactive graphic, you can explore EMSI’s data on manufacturing jobs and exports. The data is based on 4-digit NAICS manufacturing sectors. NOTE: 6-digit data was used in the previous analyis.

Click on the chart to highlight an industry or use the drop-down box. Data in the top half of the graphic shows percentage change in jobs (on the y-axis) and exports (on the x-axis). The bottom line graph simply compares manufacturing jobs and exports over time.

As we highlighted above, 71% of all manufacturing sectors increased their exports while decreasing their domestic workforce from 2002 to 2010.

For more information, email Rob Sentz.

Development Plans for Old Hong Kong Airport Announced

The government of the Hong Kong Special Administrative Region has outlined plans to create a "second central business district" at Kai Tak in eastern Kowloon, site of the now former international airport. Kai Tak airport was abandoned in 1998 when the new Hong Kong International Airport at Chep Lap Tok opened.

Kai Tak is in the middle of the most dense urban development in the high income world. The government intends that the development will have 43 million square feet of office space (4 million square meters) and will cost HK$100 Billion (approximately $13 billion).

The development would be served by a monorail, which would connect with MTR (metro) lines at Kwun Tong and to a proposed central link MTR line to the new town of Sha Tin.

Photo: Kai Tak Airport and East Kowloon (by author)

Placing Amtrak Records in Context

The state of Michigan recently announced record ridership on three routes supported by Michigan taxpayers. Records mean little when the numbers are insignificant.

That, to say the least, is the situation with Amtrak in Michigan. For example, the additional passengers (this year versus last) on the Pere Marquette (between Chicago and Grand Rapids) was small enough to be carried in a once daily round trip by an airport shuttle van. The additional passengers on the Wolverine, which operates from Detroit to Chicago would not have filled a single intercity bus operating each way on a daily basis. The same is true of the Blue Water, which operates between Port Huron and Chicago.

But there's more. High quality bus service, featuring on-board high speed wireless internet (wi-fi), costs passengers less between Detroit and Chicago and takes about the same time. There is a big difference, however. Train riders are subsidized by taxpayers, while bus riders pay their full fare. Even so, the unsubsidized bus fares are lower than the subsidized train fares.

In a nation that needs to cut spending, unnecessary transportation subsidies, such as for intercity rail services should be at the top of the list.

OECD Cites Shorter US Work Trip Travel Times

Catherine Rampell of The New York Times describes a new Organization for Economic Cooperation and Development report concluding that Americans have among the shortest work trip travel times in the developed world (Link to chart in The New York Times).

Out of 23 OECD nations, only three have shorter one way work trip travel times than in the United States. These are Sweden, Denmark and Ireland. These are nations without the larger metropolitan regions that characterize the United States and some other nations. For example, the largest metropolitan area in these three nations, Stockholm, with barely rate among the top 30 in the United States.

The OECD report confirms similar earlier data, such as from Eurostat on the relative ease of commuting in the United States.

The US average of 28 minutes to and from work was 10 minutes less than the OECD average and 9 minutes less than Canada. South Korea, with the highest urban densities in the high income world, had an average one-way commute time approximately double that of the United States.

Among the nations in the survey, the United States has the lowest urban population densities. This reality is at odds with the contentions of some analysts who have associated longer travel times and greater traffic congestion with lower urban population densities.

But shorter commute times are about more than density. This is illustrated by comparing the Los Angeles and Toronto urban areas. The two urban areas have almost identical population densities, at 7068 and 7040 persons per square mile respectively (2,729 and 2,718 per square kilometer). The density of the core areas is similar with proportions of land areas at above 10,000 persons per square mile (4,000 per square kilometer). The most important differences are that in Los Angeles, the transit commuting share is one third that of Toronto, and automobile commuting is more prevalent. Employment in Los Angeles is much more dispersed, with less than 5% of jobs being in the downtown area (central business district), compared to approximately 15% in Toronto.

Each of these factors might be thought to contribute to longer commuter times for those in Los Angeles. However, one way commute times in Los Angeles are nearly one-third less than in Toronto. The latest data indicates that the work trip averages 28 minutes in Los Angeles and 40 minutes in Toronto.

This illustrates important dynamics of commuting and mobility. The keys to shorter commutes in the US are adequate roads, personal mobility (the US has the highest share of travel by automobile) and decentralization (lower density) of both jobs and housing.

------
Addendum:

Commenting on the same report, the Washington Post's Brad Plumer stumbled into fantasyland:

The Department of Transportation found that, in 2009, commutes by private car took, on average, 23 minutes. Public transportation, by contrast, took an average of 53 minutes. You could read that as an argument that more people should drive so that their commutes are shorter or as an argument that we need to bolster public transportation.

The idea of bolstering transit to equal car travel times is empty romanticism. Today, only 7 percent of metropolitan area workers can reach their jobs in 45 minutes by transit, according to the Brookings Institution (see Transit: The 4 Percent Solution). To cut transit travel times in half, and making it available to all of the metropolitan area is unrealistic.