NewGeography.com blogs

Portland Light Rail Revolt Continues

In a hard fought election campaign, voters in the city of Tigard appear to have narrowly enacted another barrier to light rail expansion in suburban Portland. The Washington County Elections Division reported that with 100 percent of precincts counted, Charter Amendment 34-210 had obtained 51 percent of the vote, compared to 49 percent opposed.

The Charter Amendment establishes as city policy that no transit high capacity corridor can be developed within the city without first having been approved by a vote of the people. High capacity transit in Portland has virtually always meant light rail.

In a previous ballot issue, Tigard voters had enacted an ordinance requiring voter approval of any city funding for light rail. Similar measures were enacted in Clackamas County as well as King City in Washington County. Across the Columbia River in Clark County (county seat: Vancouver), voters rejected funding for connecting to the Portland light rail system. After the Clackamas County Commission rushed through a $20 million loan for light rail (just days before the anti-light rail vote), two county commissioners were defeated by candidates opposed to light rail, with a commission majority now in opposition.

Further, a Columbia River Crossing, which would have included light rail to Vancouver was cancelled after the Washington legislature declined funding. In a surreal aftermath, interests in Oregon seriously proposed virtually forcing the bridge on Washington, fully funding the project itself. A just adjourned session of the Oregon legislature failed to act on the proposal, which now (like Rasputin) appears to be dead.

At the same time, Portland's transit agency faces financial difficulty and has been seriously criticized in a report by Secretary of State. The agency has more than $1 billion in unfunded liabilities and carries a smaller share of commuters than before the first of its six light rail and commuter rail lines was opened. Moreover, the latest American Community Survey data indicates that 3,000 more people work at home than ride transit (including light rail and commuter rail) to work in the Portland metropolitan area. Before light rail (1980), transit commuters numbered 35,000 more than people working at home. Over the period, transit's market share has dropped one-quarter.
The Limits of Portland's Craft Economy

Charles Heying, the author of Brews to Bikes: Portland’s Artisan Economy, covers Portland’s indie fashion, book and music sector, its recycling/reuse businesses, craft businesses, bike sector, technology businesses and non-profits.

His thesis is that Portland represents a return to the craftsmanship that defined the pre-industrial age. Heying mostly denies that the artisan economy produces high-end goods for a limited market, and sees it as a broader shift in our society away from mass production. A critic of Richard Florida’s theories, he denies that cities should make cosmetic changes to attract well educated professionals. Instead, he sees the artisan economy as something that emerges from below, rather than imposed from above by local officials.

But there are some problems with this thesis. Portland has many coffee roasters, but it also has many Starbucks. Silicon Forest, Portland’s tech hub, includes IBM, Intel and Techtronics. None of these firms are small, artisan firms. There are indie designers in Portland but Nike and Columbia Sportswear and Adidas also call Portland home. Sure, twelve percent of people in Portland bike, but that means a lot rely on the car as a primary mode of transportation. And only twelve percent of the beer consumed in Portland is craft beer. If 'small is beautiful' really defines this city, then why are there so many big companies lurking around?

Artisanal enterprises come along with the advancement of information technology, but will in no way replace mass production. I don’t think there will be many small-scale train, airline or automobile companies. The mini-economy represents a side of us that doesn’t want the creative impulse to die, and wants a more socially responsible model, but it won’t shove aside the big model anytime soon.

Business Insider: "Americans are Still Moving to the Suburbs"

Andy Kiersz's article in the Business Insider  (see Americans are Still Moving to the Suburbs) summarizes data from the US Census Bureau's American Community Survey (ACS) to conclude that "Americans still love the suburbs, and are still moving there from big cities."

This has long been and continues to be indicated in the data, even as major media rely on anecdotes are to suggest that large numbers of people are leaving the suburbs to "return" to the core cities (from which, by the way, most never moved). There is no doubt that the core cities are doing much better than before, and that is a good thing. Much of this is because the cities are safer than in the 1970s and 1980s. The historic urban core has been restored as an integral part of the modern urban area. However, promoting the health of core cities does not require demeaning or dismissing the suburbs, which are just as integral to modern urbanism as core cities.

Kiersz refers to a list of the 25 largest met migration movements between counties as reported by the ACS for 2007 to 2011. In every case, the 25 largest net domestic migration movements are from more highly urban core environments to more suburban environments (domestic migration is measured only at the county level).

The list shows that even within the nation's largest core city, New York, people are moving to more dispersed areas. This includes net migration from Manhattan to the Bronx and Brooklyn to Queens. Then there is the suburban movement, with a stream of migrants from Queens, in the city to adjacent, suburban Nassau County. Migration from Nassau County even further out, to Suffolk County also made the top 25.

The outward movement is not limited to New York. A net 50,000 people left the Los Angeles metropolitan area than arrived, just among the 25 largest county migration pairs. Most went to the Riverside-San Bernardino area (which depending on the definition can be called "exurban") and a large number to the Bakersfield metropolitan area. Within the metropolitan area, 10,000 moved from Los Angeles County to Orange County.

The city (also a county) of San Francisco, which has had the strongest growth of any fully developed major US municipality that has not annexed since 1950, lost 5,000 people to nearby suburban San Mateo County.

The top 25 also includes nearly 20,000 people moving from Chicago's core Cook County to three suburban counties.

It will probably be quite a long time, if ever, before the top 25 migration list has meaningful representation showing movement from suburban counties to core counties. Yet, today's more healthy cities will do better if they genuinely tackle their remaining challenges. Most important are their education systems that send a disproportionate share of young families to the suburbs. However, from the United States to Europe, Japan, and China, the natural order is that cities (metropolitan areas with their core cities, suburbs, and exurbs) tend to disperse as they add population. That reality is again confirmed by the new data.

Commuter tax on Suburbanites Working in Indianapolis?

According to the Indianapolis Star, Mayor Greg Ballard of Indianapolis is poised to improve the slowing growing city's competitive position relative to the suburbs.  The Star  noted:

"Indianapolis may be a bigger draw than surrounding areas in attracting young residents, but it’s got a problem."

"Right as they begin raising families, many in their 30s split for the suburbs — taking their growing incomes, and the local taxes they pay, to bedroom communities in Hamilton, Johnson, Hendricks and other counties."

Mayoral Chief of Staff Ryan Vaughn told The Star that initiatives would include a focus on improving schools, and public safety, both of which had much to do with the decades long declines of US central cities. Vaughn told the newspaper that "Ballard wants to focus on strategies to compete more fiercely with suburban counties that draw — and keep — middle- and higher-income residents."

Certainly, the fact that central cities are far safer today than they were when New York's Mayor Rudolph Giuliani implemented his much copied policy of intolerance toward crime in the early 1990s. Even so, Mayor Ballard has it right. Long term, sustainable recovery of cities as livable environments within the metropolitan economy requires both good public schools and an environment in which parents feel that they and their children are safe.

There is a cautionary note however. While the Mayor's office is on the right track in wanting to solve the endemic problems that have so weakened core cities such as Indianapolis, he has yet to take a position on a proposed commuter tax that would be levied against employees who live in suburban counties and work in the city. This would make the suburbs more attractive for employers who are presently located in the city. Further, it would make the suburbs more competitive to businesses that choose the Indianapolis area for relocation. Trying to attract and keep middle income households, while repelling business makes little sense.

North Dakota Leads Population Growth Again

New US Census Bureau state level estimates have just been released. Repeating the pattern similar to that developing since 2010, North Dakota, the District of Columbia, Texas, Utah and Colorado have posted the strongest percentage gains.  North Dakota added 3.1 percent to its population between 2012 and 2013 and 7.6 percent since the 2010 Census. Close behind was the District of Columbia, which added 7.4 percent since 2010, though its growth over the past year has been at a lower 2.1 percent rate.

Texas added the most residents of any other state over the last three years (1.3 million), a fifth more than 22nd ranked California, which is nearly 50 percent larger. Texas has added 5.2 percent to its population since 2010, while California has added 2.9 percent.

Utah grew 5.0 percent, followed closely by Colorado, at 4.8 percent.

Former perennial growth leader Florida continues to recover, placing 6th, with a three year growth rate of 4.0 percent. At its present growth rate, Florida should pass New York by 2014, to become the fourth largest state. South Dakota, Washington, Arizona and Alaska rounded out the top ten.

The slowest growing states were Rhode Island (the only state to lose population since 2010), Maine, West Virginia, Michigan and Vermont. A table is attached with the data.


States Ranked by 2010-2013 Population Change
Rank   2010 Census 2012 2013 Pop. Change 2010-2013 % Change 2012-2013 % Change 2010-2013
1  North Dakota           672,591        701,345        723,393         50,802 3.1% 7.6%
2  District of Columbia           601,723        633,427        646,449         44,726 2.1% 7.4%
3  Texas      25,145,561   26,060,796   26,448,193    1,302,632 1.5% 5.2%
4  Utah        2,763,885     2,854,871     2,900,872       136,987 1.6% 5.0%
5  Colorado        5,029,196     5,189,458     5,268,367       239,171 1.5% 4.8%
6  Florida      18,801,310   19,320,749   19,552,860       751,550 1.2% 4.0%
7  South Dakota           814,180        834,047        844,877         30,697 1.3% 3.8%
8  Washington        6,724,540     6,895,318     6,971,406       246,866 1.1% 3.7%
9  Arizona        6,392,017     6,551,149     6,626,624       234,607 1.2% 3.7%
10  Alaska           710,231        730,307        735,132         24,901 0.7% 3.5%
11  Wyoming           563,626        576,626        582,658         19,032 1.0% 3.4%
12  Nevada        2,700,551     2,754,354     2,790,136         89,585 1.3% 3.3%
13  North Carolina        9,535,483     9,748,364     9,848,060       312,577 1.0% 3.3%
14  Virginia        8,001,024     8,186,628     8,260,405       259,381 0.9% 3.2%
15  South Carolina        4,625,364     4,723,417     4,774,839       149,475 1.1% 3.2%
16  Hawaii        1,360,301     1,390,090     1,404,054         43,753 1.0% 3.2%
17  Georgia        9,687,653     9,915,646     9,992,167       304,514 0.8% 3.1%
18  Delaware           897,934        917,053        925,749         27,815 0.9% 3.1%
19  California      37,253,956   37,999,878   38,332,521    1,078,565 0.9% 2.9%
20  Idaho        1,567,582     1,595,590     1,612,136         44,554 1.0% 2.8%
21  Maryland        5,773,552     5,884,868     5,928,814       155,262 0.7% 2.7%
22  Oklahoma        3,751,351     3,815,780     3,850,568         99,217 0.9% 2.6%
23  Montana           989,415     1,005,494     1,015,165         25,750 1.0% 2.6%
24  Oregon        3,831,074     3,899,801     3,930,065         98,991 0.8% 2.6%
25  Tennessee        6,346,105     6,454,914     6,495,978       149,873 0.6% 2.4%
26  Nebraska        1,826,341     1,855,350     1,868,516         42,175 0.7% 2.3%
27  Massachusetts        6,547,629     6,645,303     6,692,824       145,195 0.7% 2.2%
28  Minnesota        5,303,925     5,379,646     5,420,380       116,455 0.8% 2.2%
29  Louisiana        4,533,372     4,602,134     4,625,470         92,098 0.5% 2.0%
30  Arkansas        2,915,918     2,949,828     2,959,373         43,455 0.3% 1.5%
31  Iowa        3,046,355     3,075,039     3,090,416         44,061 0.5% 1.4%
32  Kansas        2,853,118     2,885,398     2,893,957         40,839 0.3% 1.4%
33  New York      19,378,102   19,576,125   19,651,127       273,025 0.4% 1.4%
34  Indiana        6,483,802     6,537,782     6,570,902         87,100 0.5% 1.3%
35  Kentucky        4,339,367     4,379,730     4,395,295         55,928 0.4% 1.3%
36  New Mexico        2,059,179     2,083,540     2,085,287         26,108 0.1% 1.3%
37  New Jersey        8,791,894     8,867,749     8,899,339       107,445 0.4% 1.2%
38  Alabama        4,779,736     4,817,528     4,833,722         53,986 0.3% 1.1%
39  Wisconsin        5,686,986     5,724,554     5,742,713         55,727 0.3% 1.0%
40  Missouri        5,988,927     6,024,522     6,044,171         55,244 0.3% 0.9%
41  Mississippi        2,967,297     2,986,450     2,991,207         23,910 0.2% 0.8%
42  Connecticut        3,574,097     3,591,765     3,596,080         21,983 0.1% 0.6%
43  Pennsylvania      12,702,379   12,764,475   12,773,801         71,422 0.1% 0.6%
44  New Hampshire        1,316,470     1,321,617     1,323,459           6,989 0.1% 0.5%
45  Illinois      12,830,632   12,868,192   12,882,135         51,503 0.1% 0.4%
46  Ohio      11,536,504   11,553,031   11,570,808         34,304 0.2% 0.3%
47  Vermont           625,741        625,953        626,630              889 0.1% 0.1%
48  Michigan        9,883,640     9,882,519     9,895,622         11,982 0.1% 0.1%
49  West Virginia        1,852,994     1,856,680     1,854,304           1,310 -0.1% 0.1%
50  Maine        1,328,361     1,328,501     1,328,302              (59) 0.0% 0.0%
51  Rhode Island        1,052,567     1,050,304     1,051,511         (1,056) 0.1% -0.1%
 United States  308,745,538 313,873,685 316,128,839    7,383,301 0.7% 2.4%


Srirachagate Gives a Window Into California’s Business Climate Problem

I love Huy Fong Foods’ Sriracha sauce as much as the next guy, which is to say a lot. The red hot sauce with the rooster on the bottle has a cult following across the nation. So unsurprisingly it made national news when the city of Irwindale, CA sued to shut down production at the company’s processing plant there. The processing of the hot peppers, done during only a limited time of year because Huy Fong only uses fresh peppers, was alleged to be causing a noxious odor in the town.

This looks like a pretty garden variety dispute between neighbors and an industrial business. Clearly industrial odors can be a problem. I don’t know how long they’ve been in Irwindale, but Sriracha has been around a long time so I’m a bit skeptical something changed just this year. Regardless, I don’t think odor complaints are necessarily evidence of a bad business climate as there could be a legitimate problem.

Then came the state order to stop shipping the product for 30 days. The state of California decided that to reduce the risk of food borne illnesses, the sauce had to sit for 30 days before it can be shipped. Keep in mind, this is for a product that has never had a complaint against it for making someone sick.

How many businesses can afford to halt shipments for a month and survive? Sriracha has a cult following and so they’ll likely overcome it. But many businesses wouldn’t have this luxury. When their customers can’t get product, they lose the business. Indeed, I wouldn’t be surprised if restaurants do turn to alternative suppliers. At a minimum, Huy Fong is going to lose a lot of sales.

Who in their right mind would want to do business in a state like this? And this is far from the worst case. It just so happens that because this is such a popular consumer product, it’s visible. If even these types of companies get shut down, how much more so a firm where this wouldn’t create an avalanche of bad publicity?

Urbanists put way too little thought into business climate, which can sound like such a shady way of saying cut services and taxes. But taxes are often the least part of it. It’s the regulatory apparatus that makes doing business in many places too painful to contemplate. This even affects city-suburb investment patterns. I’ve observed that in many places, the urban core is a flat out terrible place to do business, unless you’re very politically wired up.

This doesn’t usually bother urbanists all that much until a trendy business they like gets affected. For example, an urban farming supply shop in Providence called Cluck got sued when they tried to open. The beautiful and the bearded were outraged and the shop was ultimately approved. But there’s no similar visibility or outrage when a Latino immigrant runs into the red-tape buzzsaw when he tries to open a muffler shop.

If we want to promote investments in our cities and states, we need to be focused on basics like an objective, predictable regulatory framework that operates in the timely fashion and in which arbitrary denials, rule changes, and such are minimized. This is way more important to attracting capital investment than sexier items like streetcar lines.

This piece first appeared at The Urbanophile.

Court Rules Against California High Speed Rail

California Superior Court Judge Michael Kenny ruled against the California High Speed Rail Authority in two decisions announced on November 25. In the first, Judge Kenny ruled that the Business Plan failed to meet the requirements of the voter approved referendum under California Assembly Bill 3034 (2008), in not identifying sufficient capital funding for the first segment. As a result, the Business Plan needs to be redrafted. In the second decision, Judge Kenny declined to issue a conformity ruling that would have paved the way for $8 billion in bonds that had been approved by voters, which were also subject to same Assembly Bill 3034.

Judge Kenny declined to stop construction of the project, which is scheduled to start in the Spring. However, the Authority only has federal funds for that segment, and which would require, in the longer run, matching state funds (which were to have been from the bonds).

According to the San Francisco Chronicle , Kenny's found that the California High Speed Rail Authority "abused its discretion by approving a funding plan that did not comply with the requirements of law."

The Undead Suburban Office Market

The restoration of central city living and working environments has been one of the more important developments in the nation’s metropolitan areas over the past two decades. Regrettably, a good story has been exaggerated out of all proportion in the print, electronic and online media.  

Exaggerating Core Population Increases: The rise of population in urban cores has been important, but it has too often been used to suggest the apparent, but fallacious opposite, suburban decline. In fact, the suburbs are hardly in decline, with 93.5 percent of major metropolitan area growth outside a 10 mile radius from city hall between the 2000 and 2010 censuses (See: Flocking Elsewhere: The Downtown Growth Story).

Exaggerating CBD Office Space Gains: Similar misinformation had been circulating about office space outside the nation’s CBDs (central business districts, or “downtowns”). Commercial real estate information company Costar’s Randyl Drummer recently described suburbia’s improving fortunes (See: Once Left for Dead, Suburban Office Making a Comeback).

“Some analysts wrote the obituary of the suburban office campus as downsizing companies shed millions of square feet, in many cases consolidating into buildings closer to public transit in urban centers.” 

It’s just not happening, according to Costar research:

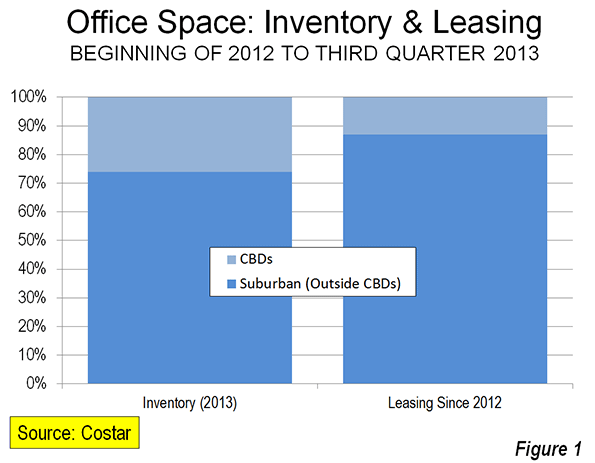
“Overall, the suburbs have garnered more than their usual share of leasing demand over the past two years, according to an analysis by CoStar real estate economists. Since the beginning of 2012, suburban markets have accounted for a whopping 87% of office demand -- which is 13% more than their 'fair share' based on the total market size compared with CBD office markets, according to data presented at CoStar’s recent third-quarter office review and forecast.” 

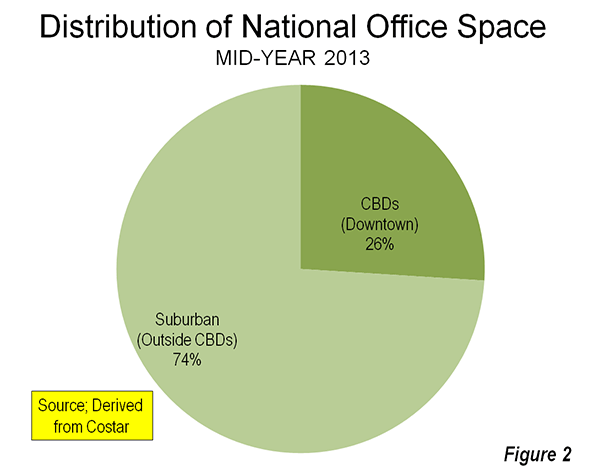
Indeed, CBD leasing, at 13 percent of the total, is a full 50 percent below their current share of inventory (Figure 1). As of mid-2013, the suburbs accounted for nearly three quarters of the nation’s office inventory (Figure 2).

Costar cites strong suburban development in Raleigh’s Research Triangle, and further notes that:

A diverse set of markets that include Sacramento, San Jose, Austin, Kansas City and Charlotte have posted some of the strongest net office absorption among suburban markets.

This is despite the glowing publicity being given to core area development, especially in places like Charlotte and Austin.

The reality is that the monumental CBD towers dominating metropolitan skylines do not indicate downtown dominance. In fact, throughout the high income world, most metropolitan employment is outside CBDs. In the United States, typically 90 percent of employment is outside the CBDs. The suburban employment (outside the CBD) share is a bit smaller in Western Europe, Canada and Australia, but still averages approximately 80 percent or more.

The good news is that neither suburbia nor downtown is dead.

Can the Rust Belt Learn From Dixie?

Aaron Renn's recent piece on the Rust Belt has some formidable strengths that can be the foundation of its revitalization, but it has a set of structural problems that must be confronted to achieve true revitalization.  Current revitalization strategies, he suggests, are outside of each city's system or fail to bring the appropriate heft to lift all those who need lifting -- largely because they only obliquely address the structural challenges.  The challenges:

  • Racism
  • Corruption
  • Closed societies
  • Two-tiered environment and resulting paralysis

I won't rehash Aaron's assessment, but I do agree with it.

What occurred to me is that, if you think about it, the South's cities were in the same position following the Civil War -- and faced the same obstacles -- until after World War II.  Racism clearly plagued Southern metros and hindered growth during that era; many places were well known for their corruption.  The South certainly had a reputation for being a closed society, unwelcome to outsiders, and its history of reliance on low- and moderately-skilled labor made the South perhaps more skeptical of highly educated labor, just like in the Midwest.

Following World War II, however, Southern metros began to make great strides to catch up with and even surpass Northeastern and Midwestern cities.  I'm no scholar on post-war Southern growth, but it appears Southern metros took on these strategies to move upward and onward:

Tolerate Newcomers.  After World War II Southern cities realized that they could no longer rely on intra-region growth if they were going to prosper, particularly during a period with widespread migration of blacks to Northern cities at the time.  Southern business leaders rightfully recognized opportunities to bring businesses and residents to the South from other parts of the country.

Seeing education as an asset.  It's no coincidence that the Southern metros that have developed the strongest post-war economies -- Atlanta, Charlotte, Dallas, Houston, Austin, Raleigh, Nashville -- are home to significant educational institutions.  After the war the colleges and universities of large Southern metros became integral to their growth.

Becoming a low-cost alternative to the rest of the country.  Prior to their turnaround Southern cities probably described themselves in terms of what they lacked in comparison to Northern cities.  They did not have the impressive skylines, the classic neighborhoods, the exceptional park systems or the infrastructure that were the legacy of Northern cities.  However they did have cheap land and cheap labor, and those factors became the driver that facilitated the development of what they lacked.

The above strategies, combined with the widespread use of air conditioning that made the Southern climate more tolerable, allowed for the growth of Southern metros. 

The Rust Belt should take note.  While the South only address race as the federal government made them, perhaps the Rust Belt can become a leader in addressing race matters.  If the South can learn to become more tolerant of outsiders, the Midwest can as well; it does have a legacy of immigration that can serve as a foundation.  Advocates of the Rust Belt Chic movement may turn the low-cost strategy on its head -- the Rust Belt has a unique physical and social legacy that those who've grown up in places with less would welcome.  And the Rust Belt has perhaps the greatest collection of public research universities in the nation (even if most are located in smaller metros and not the big cities), and they could be a huge driver of revitalization.

Clearly, the South did not get everything right.  But when faced with an existential crisis not unlike what the Rust Belt faces today, they adapted.  The Rust Belt must find its strengths and play to them.

Subjects:

Well-Heeled in the Windy City

A couple weeks ago, noting the apparently immunity of global city Chicago to problems elsewhere in the city, I asked the question: What happens when global city Chicago realizes there’s a good chance it can simply let the rest of the city fail and get on with its business?

I’d argue we’re seeing the results right before our eyes.

At the same time murders in significant parts of the city are even higher than during the peak of the crack epidemic, when the city says its too poor to hire more cops, when 54 schools are closed and a 1000 teachers laid off, half the mental health clinics closed, libraries cut back, etc., Chicago has found a nearly limitless stream of money for elite amenities, most recently – and appallingly – $50+ million in TIF subsidies for a new DePaul arena. There’s also been hundreds of millions of dollars more in corporate welfare under Daley and Rahm.

Investing in success is a great idea – if you plan to harvest a return on that investment to fund city services and your safety net. It’s clear there’s no intention of doing this in Chicago. I discuss this in my most recent City Journal piece, “Well-Heeled in the Windy City.” Here’s an excerpt:

Clearly, cities like Chicago must retain a substantial portion of upscale residents and businesses. Detroit and other cities show the results of failure on this front. Yet the moral case for elite amenities has always rested on the assumption of a broader public good: what benefited the wealthy would also make life better for the rest of the city….Under Emanuel’s leadership, though, Chicago has made peace with a two-tier society and broken the social contract. Rather than trying to expand opportunity, Chicago has bet its future on its already successful residents—leading some on the left to call Emanuel Mayor 1 Percent. The Windy City isn’t alone in following this strategy. Detroit has gone bankrupt, but that hasn’t stopped city government from lavishing $450 million in subsidies on a new Red Wings arena.

Since I critique bike infrastructure as part of Chicago’s splurge for the elite, I want to clarify that point here where there are lots of bike advocates. I strongly support bike infrastructure. In fact, I once gave a presentation where I said protected bike lanes and bike share should be Rahm’s top two transport priorities on taking office because they are cost-effective and can leverage outside funds. However, even the most passionate advocates must admit that the optics are bad on making a full court press on bike lanes when cutting core services elsewhere. More importantly, Rahm’s explicit rationale on bike infrastructure has been luring talent for the tech economy, thus it is an elite focused venture. For example, the Sun-Times reported:

Emanuel called protected bike lanes central to the city’s sustainability plan and his efforts to make Chicago the high-tech hub of the Midwest. Chicago “moved up dramatically” in the list of major cities whose employees bike to work, he said.

“It’s part of my effort to recruit entrepreneurs and start-up businesses because a lot of those employees like to bike to work,” he said.

“It is not an accident that, where we put our first protected bike lane is also where we have the most concentration of digital companies and digital employees. Every time you speak to entrepreneurs and people in the start-up economy and high-tech industry, one of the key things they talk about in recruiting workers is, can they have more bike lanes.”

I’m simply taking the mayor at his word. (See also here and here).

This piece originally appeared at The Urbanophile.