NewGeography.com blogs
Analysts occasionally note that urban areas ("cities") are becoming larger and denser. This is only half right. It is true that most of the world's urban areas are becoming larger, with megacities like Delhi, Jakarta, Shanghai, Beijing and Manila adding more than five million people in the last decade and most other urban areas are growing, but not as fast.
Understanding Urban Areas: However almost without exception, urban areas are getting less dense. Because there is so much confusion about city "definitions," a clarification is required. The only geography for which overall urban density can be measured is the urban area, which is the area of continuous development. The urban area is not constrained by municipal or other jurisdictional boundaries and does not include rural (undeveloped) territory, even if it is in a "central city" (such as Rome, Ho Chi Minh or Marseille, with their expansive boundaries). An urban area is also different from a metropolitan area, because metropolitan areas (as labor markets) always include rural territory, which is by definition not urban.
1960-1990 Data: Historical urban population density is not readily available. Kenworthy and Laube were pioneers in this area, publishing estimates from 1960 to 1990 for a number of urban areas. That data indicates density losses in the more than urban areas for which they were able to develop comparable data. The world average decline was 20 percent, ranging from 15 percent in the United States to 29 percent in Europe and 33 percent in Australia. While Tokyo was doubling in population, its population density was dropping 17 percent between 1960 and 1990. While Zurich was adding 21 percent to its population, it was becoming 13 percent less dense.
Recent Data: The dispersion continues, which is indicated by these high-income world cases:
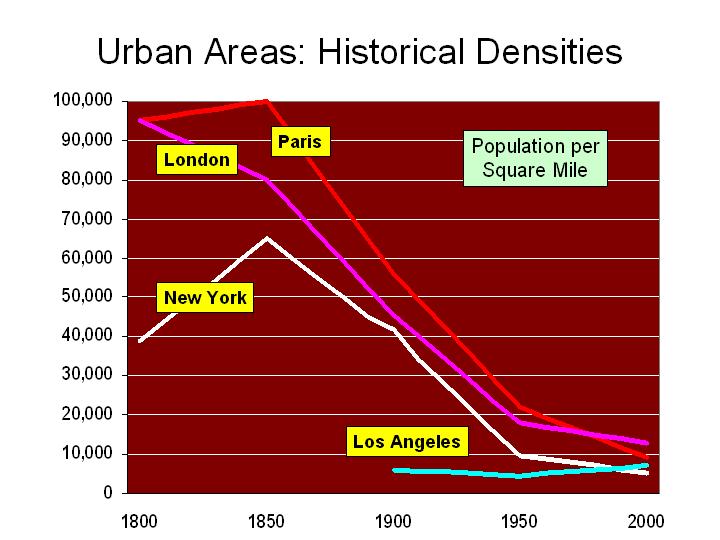
Today, the ville de Paris has 700,000 fewer people than at its peak, and inner London (generally the former London County Council area) has lost more than 1,500,000 people since its peak. All growth has been in lower density suburban areas in both the London and Paris urban areas.
In the United States, urban areas with more than 1,000,000 population more than doubled in population from 1950 to 2000 (2010 data not yet available), while the population density dropped by nearly one-third. Detailed analysis indicates that this trend has continued over the past decade in New York, Los Angeles, Chicago, Dallas-Fort Worth, Seattle, St. Louis and other major US urban areas.
The dense core city of Seoul has been losing population and all growth has been in the suburbs, which are lower density.
The dense urban core of Milan has experience substantial population losses, while the less dense suburbs have captured all the growth.
Dispersion is not limited to high income urban areas, with declining densities in evidence across lower and middle income nations as well. For example:
Nearly all of the growth in Jakarta has been in the suburbs for the last 20 years, while the core has gained little in population. The net effect is a less dense, but much larger urban area, because the suburbs are not as dense.
Nearly all of the growth for 30 years in Manila has been in the suburbs, while the core city. Again, the urban area has become much larger, but much less dense because the suburbs are much less dense.
The dense core of Shanghai has lost population and all growth has been in the suburbs, which are lower density.
The population in the dense core of Beijing has nearly stopped growing, with nearly all population in the suburbs, which are lower density.
The core of Mumbai has lost population in two of the last three census periods, while all growth has been in the suburbs, which are lower density.
The urban core of Mexico City has been declining in population since 1960 and all of the growth has been in the suburbs, which are less dense.
The dense core city of Buenos Aires has fewer people today than in 1947, while at least 8 million people have been added to nearly 1,000 square miles of lower density suburbs.
Urban growth continues to be overwhelmingly in less dense suburban areas, rather than in the more dense urban cores, and as a result even as urban areas grow, they become less dense. This is how cities grow.
Strange to say, but there may be something valuable going on among some of the Occupy Wall Street protesters.
Until now, two narratives have defined both the press coverage and public discussion of the Occupy Wall Street demonstrators camped out in lower Manhattan's Zuccotti Park.
The first depicts a collection of buffoonish, semiliterate juveniles engaged in a seeming left-wing version of a college prank. There is, to be sure, something to this story.
In last week's Zombie Parade the protesters, giddy with their cleverness, portrayed themselves as the living dead whose lives had been sucked from them by unnamed corporations.
One of the pre-Halloween costumers was asked why she had chosen to dress up like a zombie who looked like Marie Antoinette, the French queen guillotined by the revolutionaries of 1793. She replied that she had no idea of who Marie Antoinette was but just liked the look of the costume.
The second narrative sees the protesters as ripe to be harnessed by the labor leaders who hope to tap into their energy on behalf of the Obama 2012 campaign.
Watching New York Federation of Teachers President Mike Mulgrew prance about, speaking in the name of the protest, you might think Occupy Wall Street had signed on to a campaign to raise teachers' salaries in a city whose budget shortfalls are already producing layoffs.
But both of these explanations presume that there is a single, largely unified group of people in Zuccotti Park. There isn't. The exhibitionists, lost souls and zanies acting out tend to congregate in the Western stretch of the block-long park.
To their east, where anti-Obama placards outnumber those supporting the president, a more cerebral group of protesters is gathered. Their organizational skills have kept the encampment running in reasonably good order for these past three weeks.
Some of them, carrying anti-Obama placards, are standard issue leftists who, like the New York Times editorial board, think that the president's problem is that he has been too moderate and thoughtful.
But others are caught up in the practical details of self-government on a small scale. They are doing their best not to be co-opted, which is why, despite the hoopla from labor leaders, they haven't signed on to the union campaign. Like Students for a Democratic Society in the early 1960s, they are grappling with a paradox.
On the one hand, they insist that corporations ineffectively run the government; on the other, they want more government regulation to control the corporations.
By contrast, the Tea Party has a ready and plausible answer as to how to restore self-government and break the grip of the crony capitalism that ties the Obama administration to Wall Street. They want to drastically reduce the size of government.
The protesters have no such view. Like their 1960s predecessors, they're chasing their tails trying to imagine procedural reforms that will allow the demonstrators to govern themselves, while also curbing the power of those greedy capitalists.
It's too easy to dismiss the protesters, with their "Eat The Rich" signs, as just spoiled "trustafarian" misfits. They see themselves as the American equivalents of Egypt's Tahrir Square protesters who brought down President Hosni Mubarak, but they haven't noticed that it's the Islamists who are inheriting the Arab Spring.
Mocking them is easy; but here at home, the problem of crony capitalism is in fact eating away at our civic entrails. Leftists willing to grapple with this malignancy should be welcomed, if only for the potential seriousness of their efforts.
As the more thoughtful 68ers eventually discovered, the idea of reforming government by expanding it is a circular dead end.
This piece originally appeared at The Washington Examiner.
Fred Siegel is a senior fellow at the Manhattan Institute and scholar in residence at St Francis College in Brooklyn.
One of the great scams of modern political life is the charitable contributions of tax-exempt foundations associated with politicians. A perfect illustration is one charity associated with former Chicago Mayor Daley which has received some attention.
The charity, After School Matters, set up by Maggie Daley (former Chicago Mayor Daley’s wife and sister-in-law of White House Chief of Staff William Daley) has received more than $54 million from the financially troubled city. The Chicago Tribune explains that
“days before Emanuel took office, the Daley administration awarded the nonprofit a one-year, nearly $6.5 million contract to oversee summer jobs efforts and after-school programs.
The group is housed in city offices near the Cultural Center, where it pays no rent and uses city computers and phones."
The Tribune article provides some rather unusual facts. Three full time city of Chicago workers labor full time for the private charity. It also benefits from corporate contributions, as The Chicago Sun-Times’ ace investigative reporter Tim Novak explains:
"After School Matters - founded and run by Maggie Daley - raised more money in a single year than 97 percent of the 12,757 charities in Illinois filing reports with the IRS"
How this corporate support “materialized” is now coming into question. Long time Chicago media critic Steve Rhodes points out that this appears to be a shakedown racket of those who do business with the city of Chicago.
In 2008, After School Matters became prominent news because of its donor list. Prominent corporations like J.P Morgan Chase and Motorola gave significant contributions to Daley’s charity, and all received City of Chicago contracts.
This isn’t just a story about a local charity with conflicts of interest. Federal taxpayers are giving federal stimulus dollars to the Daley charity. Even Mayor Rahm Emanuel, the Chicago Sun-Times reports, admits “the city should not be dictating which charities recipients of city subsidies should donate to.”
Former Mayor Daley is upset that anyone would think that his wife’s charity isn’t fully dedicated to helping children. The Chicago Sun-Times reports:
Former Mayor Richard M. Daley on Monday denounced as “disgraceful” and a “personal insult to my wife” an internal audit concluding that recipients of city subsidies were told to donate to Maggie Daley’s After School Matters program.
The former mayor insisted that no arms were ever twisted to produce donations to the charity that his wife founded to occupy and educate Chicago teenagers.
Daley’s response is textbook Chicago media spin. When confronted with facts, claim outrage and avoid the specifics.
Weakness in housing activity and in housing prices continues to be a major drag on the overall economy. My colleagues at California Lutheran University's Center for Economic Research and Forecasting have long maintained that the home ownership rate (HOR) needs to fall back to its historical norm of 64% before housing can recover. Their view has been that the attempt to increase the HOR by loosening credit standards contributed to creating financial instability. In a classic case of unintended consequences, the attempt to improve the home ownership rate contributed to rising home prices which ended up lowering affordability for first-time buyers.
A rising home ownership rate has been a major goal of public policy for several decades under both Republican and Democratic administrations. The rationale was multi-part. First, it was believed that communities are stronger where home ownership is greater. Second, building equity in a home was viewed as the primary path to improving a family’s financial condition. Finally, lower home ownership among minorities was felt to be an indicator of bias.
Policies directed towards increasing the rate of home ownership included subsidizing first time home buyers, reducing required down payments, and streamlining the application process. Weaker underwriting standards increased the effective demand for housing and helped propel a boom in housing activity and home price appreciation between 1995 and 2006. The overall HOR rose from 65% in 1990 to 69% in 2006 which was applauded on both sides of the political aisle.
However, rising home prices eventually reduced affordability and, along with excess supplies of housing due to overbuilding, led to a peak and then a decline in housing prices. The price decline eventually set in motion forces that generated severe losses to mortgage investors and homeowners alike. The underwriting pendulum shifted from easy to tight, and effective demand for houses plummeted. Millions of people have lost their homes, and many more have zero or negative equity in their homes. The homeownership rate has now declined from 69% to 66%, and appears to be headed lower.
Another fundamental indicator of housing weakness is the large number of delinquent mortgages and the implied backlog of future foreclosures. Of course, as the foreclosure backlog is worked through, the result will be a decline in the home ownership rate, as newly foreclosed-upon home owners become renters. Thus, this issue is not separate from the HOR issue.
The large number of vacant homes is also a measure of housing market health. During the period of 2002 through 2005 the housing industry massively overbuilt. The degree of overbuilding can seen by comparing the rate of household formation (about 1.1 million new households per year during this period) with total housing starts, which is the number of new units (including rentals) completed each year.
This number exceeded two million units per year during the boom. Since the end of the housing boom, total starts have fallen dramatically to around 600,000 per year. If the rate of household formation had remained at 1.1 million per year, then the surplus developed during the boom would have been eliminated by now. However, an important yet obscure statistic maintained by the Census Department, the Vacant Homes For Sale (VHFS), remains at more than one million above its long-term average. What is going on?
I suspect that the rate of household formation dramatically declined following the crisis and subsequent recession because more young adults returned to their family homes, and because multiple families are occupying the same housing unit.
The problem of too much housing stock and too few households will not be resolved purely by a lower home ownership rate. It will be resolved by rising household formation , even if the new households are renters instead of owners. What we need is more people. One strategy to accelerate the process is to streamline legal immigration and to lift or eliminate quotas on the number of people who can legally come to this country.
Jeff Speakes is Executive in Residence at California Lutheran University, and Lecturer in economics at the University of Southern California.
The Atlantic's Alex Madrigal announces "The Beginning of the End for Suburban America," a wish and hope long dressed-up as reality by a well-placed few who believe that the "be - all and end - all" is living anywhere but the suburbs. This is not to suggest that there is anything wrong with living in the core urban core if that is what one wants to do. I certainly have enjoyed living part-time in the inner core of the ville de Paris for some years. At the same time, however, the behavior of people has revealed an overwhelming preference for more space. From New York to Paris and Tokyo, some people choose to live in dense urban cores and a lot more choose to live in suburbs (and exurbs).
What data does Madrigal cite to show "the beginning of the end for suburban America"? Driving is down from a peak in 2007, also the year that employment peaked. These are not disconnected events. With the total unemployed now about equal to the number of employed workers in the New York and Chicago metropolitan areas, work trips that are not made nearly equal the decline in driving. The higher gas prices appear to have induced people (in the suburbs and in the dense cores) to make modest reductions in discretionary trips or to more efficiently organize their shopping trips.
Madrigal also points out that in 2010 new houses were smaller than their peak (also 2007). The median house size was still larger than any year before 2005 and 100 square feet larger than 2000. Madrigal cites declining rates of demand increase for electricity.
The connection between these trends and the suburbs is unclear. Madrigal does not separate the trends by residential geography, the more dense cores of metropolitan areas, the suburbs and exurbs of metropolitan areas and the balance of the nation. Granted, the data is not immediately available for such analysis.
Fortunately, there is more precise data that differentiates between dense core and suburban trends. It is the United States Census, conducted every 10 years and most recently in 2010. Between 2000 and 2010, the core municipalities of the 51 metropolitan areas with more than 1 million population captured 9% of the population growth, while the suburbs and exurbs captured 91%. The suburbs actually did better in the 2000s than in the 1990s, when they accounted for only 85 percent of the growth.
True, the relative decline of the denser cores did not resemble the disastrous decade of the 1970s. Further, the gains made by very small areas of the core over the past 10 years have been an important advance. But to suggest that the 2000s represent "the beginning of the end for suburban America" is profoundly at odds with reality.
So, the decade of the 2000s was another false start for the heralds of the suburban "end-times." The wishing and hoping has to be delayed yet again.
President Obama's new $50 billion infrastructure initiative --- part of his $447 billion American Jobs Act (AJA)---offered no surprises. It's almost an exact replica of his FY 2012 budget request which included a sum of $50 billion for transportation to "jump start" a proposed $556 billion six-year surface transportation reauthorization.
The rhetoric may have changed --- Obama avoided using the terms "stimulus" and "infrastructure" in presenting his AJA initiative to Congress---but the substance of the two initiatives is remarkably similar. Both proposals would fund an identical mix of programs (highways, transit, Amtrak, high-speed rail, aviation and the TIFIA credit program) and both would establish a National Infrastructure Bank.
The FY 2012 transportation budget request failed to obtain congressional approval for two reasons: (1) the Administration failed to show how the proposed $50 billion program would be paid for; and (2) there was no convincing evidence that the program would promptly create new jobs. Indeed, all evidence pointed in the opposite direction. The $48 billion in Recovery Act funds for transportation had failed to create the millions of jobs promised by the Administration. The money earmarked for highways had been spent largely on short term roadway maintenance-type contracts and had produced only temporary jobs. Nor was there much to show for in terms of an improved condition or performance of the nation's transportation system. As for the Infrastructure Bank, it is widely believed that at least one or two years could pass before the Bank would become operational and in a position to begin financing large-scale job-creating infrastructure projects.
The same reasons that led Congress to ignore the Administration's FY 2012 transportation budget request will likely cause the lawmakers to reject the new transportation initiative. They are skeptical that a fresh infusion of funds will succeeed where the first stimulus failed. Doing the same thing over and over again and expecting different results may not be exacly insanity but it does suggest a certain denial to look facts in the face.
The President said that "everything in this bill will be paid for" and that he will call on the Joint Deficit Committee to come up with additional deficit reductions necessary to pay for the American Jobs Act. But by proposing to end tax breaks for people making more than $200,000 and for oil and gas companies, the White House is setting itself up again for a fight with the Congress which already once before rejected this approach to "revenue enhancement." It remains to be seen if the independent congressional committee will do Obama's bidding. With the President's approval ratings at an all time low, they just might be emboldened to ignore his plea.
Note: the NewsBriefs can also be accessed at www.infrastructureUSA.org
A listing of all recent NewsBriefs can be found at www.innobriefs.com
Despite the success of the Main St. line, I've been concerned for a long time now that the next set of rail lines will essentially bankrupt Metro while providing minimal benefit (except for possibly the Universities line, which has moderate benefits, but may not get built anytime soon because of the money drain of the other lines being built first). Now the Coalition On Sustainable Transportation (COST) has come out with the numbers from other cities (especially Dallas) that don't bode well for Houston at all. Some key excerpts (I know it's a lot, but there are some really good points in here):
---------------
For example: Dallas will pay increasing debt service for many years and has 30 plus year bonds and commercial paper for its almost $4 billion of debt. Their debt service is considered annual operating costs in the chart below, because: By the time current bonds are paid, the rail system will be at the end of its service life and will need replacement through the creation of a new round of bonds, continuing this high bond expense for as long as the system operates. While other Texas cities have not yet reached this Dallas level of bond debt and expense, Houston is rapidly moving in the same direction and Austin’s planning is pointing in this direction. Currently Dallas’s debt service is about 3 times Houston’s and almost 40 times Austin’s.
...
One may look at the data in the table above in many ways, but, none of the conclusions seem to be positive for rail transit. Dallas, Houston, San Antonio and Austin are all among the top 20 fastest growing major cities in the nation. However, the three cities with various levels of rail transit, Dallas, Houston and Austin, all have declining transit ridership trends and have fewer absolute transit riders today than they had a dozen years ago. They have spent billions to implement and promote transit with a heavy focus on rail transit.
...
These data highlight a number of broader Texas Metro Area negative transit trends:
1. Metro areas with more rail transit have significantly higher costs and higher taxpayer subsidies per ride.
2. Metro areas with more rail transit have fewer total transit boardings per capita.
3. Metro areas with higher densities have fewer transit riders (boardings) per capita.
4. Dallas has the largest population and greatest population density but the least cost effective transit system: Higher cost per ride (boarding) and fewer boardings per capita.
5. Increasing the proportion of a region’s transit funds being spent on rail transit leads to less cost effective overall transit and degraded transit for the majority of transit riders who still ride busses.
Some Major Texas City Metro Areas comparisons/observations regarding transit data:
1. Dallas-Ft. Worth Metro’s population is more than 3 times San Antonio’s and Dallas’ annual transit operating expense is 4.4 times San Antonio’s but Dallas has only 1.6 times the transit ridership of San Antonio.
2. Dallas-Ft. Worth Metro’s population is 3.8 times that of Austin and Dallas’ annual transit operating expense is 3.7 times the transit expense of Austin but Dallas-Ft. Worth has only 1.9 times Austin’s ridership.
3. Dallas has the most invested, more than $4 billion, in light rail and it has the highest cost per transit ride at 2.8 times San Antonio’s costs and almost 2 times Austin’s. Dallas has the least boardings per capita, about one-half of San Antonio and Austin.
4. San Antonio’s bus only transit system has 1.2 times Austin’s ridership but only 82% of Austin’s annual operating expense.
5. San Antonio’s ‘cost per transit rider’ is about one-third of Dallas-Ft. Worth’s and San Antonio has 2 times as many transit riders per capita as Dallas-Ft Worth.
6. Dallas’ 2011 net debt service (principal and interest) budget of $153 million is greater than San Antonio’s total 2011 budgeted operating costs of $141.3 million and almost as much as Austin’s $168.2 million.
...
It is no surprise that Dallas has hit a transit financial wall causing it to pause and curtail, at least temporarily, further light rail expansion. It seems, the more light rail Dallas implements, the more inefficient and expensive its transit becomes. This is an often occurring trend when regions implement rail transit and is a serious problem trend now developing in Houston and Austin. The result is overall degradation of transit service as exorbitantly expensive rail transit and resulting debt absorb increasingly higher percentages of transit funds. This, in turn, results in increasing transit fares and reductions in bus service which have disproportionately negative quality-of-life impacts on lower income citizens. Almost everyone forgets that the majority of transit riders still ride busses even after such massive investments in rail transit such as in Dallas or in Portland, the Mecca of train transit, where well over one-half of the transit rides are on busses. More importantly, this wasteful spending on ineffective trains ‘bleeds dry’ taxpayer funds which could be used to make positive contributions in serving communities’ many, higher priority needs for all citizens. (like express commuter bus services from all neighborhoods to all job centers, as I've been advocating)
...
Much experience has shown that once a cycle of high cost rail transit is implemented, the agency becomes heavily burdened with debt for a very long time. It is highly probable that the very high debt service (principle and interest) will become a permanent and major part of the transit agency’s annual operating costs. When one issue of bonds is paid down, it becomes time for another round of debt to replace aging equipment. This, in turn results in very poor cost effectiveness and degradation of the overall transit system as it serves fewer riders at higher costs. This high debt can never be paid-off without major increases in local taxes. Transit agencies cannot responsibly project and achieve enough ridership to make rail transit cost-effective. This has even less credibility in light of the national declining trend in the use of transit and the fact that the use of transit in Texas’ major metro areas has a declining trend over the past dozen years. As Dallas and other major cities have experienced, this results in a spiraling decline in transit performance and effectiveness, degradation of mobility for low income citizens and, often, cutbacks in other higher priority city services. This results in reducing overall quality-of-life.
----------------
Is this the future we really want for Houston? Because it's not too late to stop it now, but it will be too late very, very soon, and then we will be stuck with the same harsh reality as Dallas for decades to come...
This post first appeared at Houston Strategies
We recently noted that Ryan Avent was one third right in his recent Sunday New York Times article on urban density. Avent has posted a response suggesting that it is inappropriate to use average urban densities in urban productivity analyses, as we had done, but that "weighted average densities" should be used instead. Weighted average density was not mentioned in his New York Times article.
In the interim, we were able to find the studies on urban density and productivity that seem to match those Avent refers to in his New York Times article. There are two studies concluding that doubling employment (not population) density increases productivity by six percent (Ciccone & Hall, 1996 and Harris & Ioannides, 2000), as Avent noted. Another study (Davis, Fisher & Whited, 2007) indicates that doubling employment densities could increase productivity by as much as 28 percent, also as Avent noted.
Urban and Rural Density Combined Are Not Urban Density: In contrast to Avent's preference for weighted average density, each of the studies uses average density, like with our analysis. More importantly the econometric formulas in the studies do not include an urban density variable. The density variables in all three studies include rural areas.
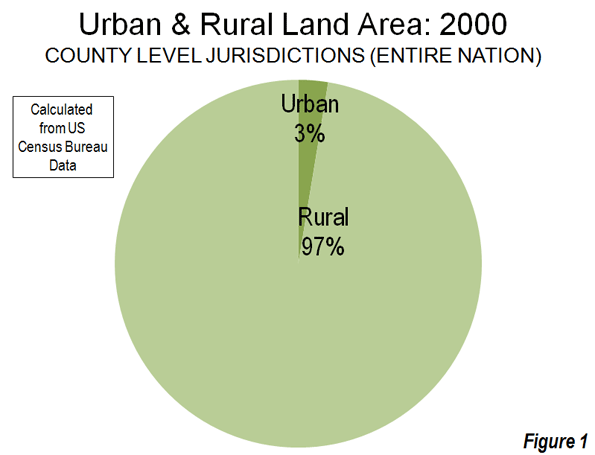
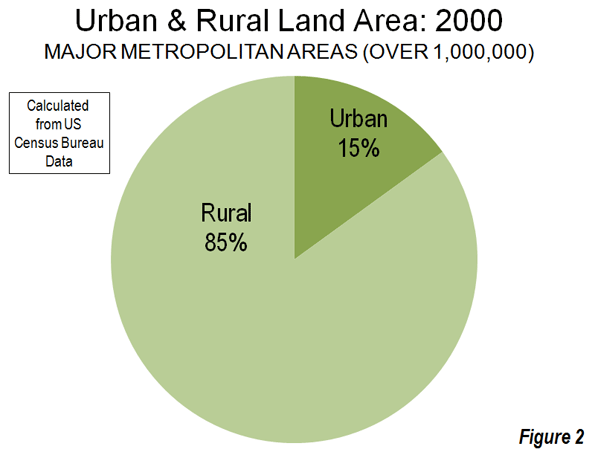
The studies use county, metropolitan area and sub-metropolitan area densities, each of which contain far more rural land than urban land. By definition, urban areas exclude rural areas and, as a result, the moment rural areas become a part of the calculation, the result cannot be urban densities. In 2000, Census Bureau data showed counties (county equivalent level jurisdictions), which comprise the entire nation, to be less than three percent urban and more than 97 percent rural (Figure 1). Metropolitan areas also have a similar predominance of rural land (Figure 1). Among major metropolitan areas (those with more than 1,000,000 population) in 2000, approximately 85 percent of the land was rural and 15 percent of the land was urban (Figure 2).
Ciccone & Hall use employment density at the county level and thus mix urban and rural densities. Harris & Ioannides use employment densities at the metropolitan statistical area or the primary metropolitan statistical area level (a sub-metropolitan designation since replaced by the more appropriately titled "metropolitan division"). Davis, Fisher & Whited use employment densities at the metropolitan statistical area level. The two studies using metropolitan areas or parts of metropolitan areas also mix urban and rural densities.
Urban Area Densities: Urban density is calculated at the urban area level, which is the area of continuous urban development. This is also called the urban footprint, which is generally indicated by the lights of the city one would see from an airplane on a clear night. Urban areas are delineated using the smallest census geographical units ("census blocks," which are smaller than census tracts) each ten years. The 2010 data will be released next year. Among urban areas, the highest density core urban area in a major metropolitan area (Los Angeles) is approximately four times the lowest (Birmingham).
Nonsensical Metropolitan Area Densities: Theoretically, metropolitan areas are labor market areas, which include a core urban area (and sometimes more than one urban area) and nearby rural areas from which people commute to work in the urban area (can be called the "commuter shed"). However, in the United States, metropolitan areas are too coarsely defined for density comparisons with one another. US metropolitan areas are composed of complete counties or, in the six New England states, complete towns. This jurisdictionally based criteria can produce metropolitan areas that are much larger than genuine labor markets in a number of cases and some that are smaller. American metropolitan areas are not spatially consistent by any functional labor market definition. Metropolitan densities are thus nonsensical, no matter what density is being measured (such as population or employment density). Among major metropolitan areas, the highest density metropolitan area (New York) is 24 times that of the lowest density (Salt Lake City), six times the maximum difference in urban area density.
Metropolitan Ireland and Happenstance: In the similarly sized San Francisco (as used by Davis, Fisher and Whited) and Riverside-San Bernardino metropolitan areas, San Francisco has 1,700 square miles of rural land, while Riverside-San Bernardino has 26,000, approximately 15 times as much. At more than 27,000 square miles, Riverside-San Bernardino covers more land area than the Republic of Ireland. The difference in population densities between metropolitan areas is determined in considerable measure by the size (land area) of the included counties, not by the number of people in cities.
If the state of California were to carve out a new county composed of western Riverside and San Bernardino counties (as Colorado created Bloomfield County in the early 2000s), the land area of the metropolitan area could be reduced 95 percent, because the remainder would not meet the criteria for inclusion in Riverside-San Bernardino. The importance of the density variable for Riverside-San Bernardino in econometric formulas would be increased many times. With only 3,100 county level jurisdictions of varying sizes, this kind of incomparability cannot help but occur. The boundaries of metropolitan areas are defined by political happenstance.
On the other hand, the nation's urban areas are built up from 7,000,000 census blocks. This permits a fine grained definition that makes urban areas appropriate for density comparisons. The definition of urban areas is beyond political fiat.
Metropolitan areas in the United States could be readily defined at the census block level, just like urban areas. Regrettably, the Office of Management and Budget missed another opportunity in the 2010 census to make the necessary criteria change. U.S. metropolitan area data is of great value for most analysis, but misleading for spatial or density analysis.
Low-Density Productivity: Subregionalizing the density and productivity analysis would pose problems. Avent uses household incomes as his standard (and we agree that cost of living differentials are important). The San Jose metropolitan area has the highest household incomes of any major metropolitan area and would therefore be among the most productive. Yet, San Jose's automobile-oriented Silicon Valley, to which much of the productivity is attributable, has a far lower employment density than the transit and pedestrian oriented cores of Manhattan and San Francisco (and yes, even not-so-transit oriented downtown Phoenix). In low-density Seattle, Microsoft's automobile oriented Redmond campus probably ranks among the most productive real estate in the country, yet its employment density (like that of Silicon Valley) pales by comparison to the higher density cores of Seattle, Phoenix, Nashville, Oklahoma City and virtually every other downtown core of a major metropolitan area.
At the End, Agreement: Avent concludes, "I just want to make sure we stop costing ourselves easy opportunities for growth." I could not agree more. It is time to abandon regulations that artificially raise housing prices, deprive households of a better standard of living, and drive them to places they would rather not live. For centuries, people have flocked to urban areas for better economic opportunities. Urban areas should be places where people can realize their aspirations, not places that repel them because it doesn't suit the interests of those already there.
Ryan Avent hits a home run, strikes out and earns a "yes, but," all in the same article ("One Path to Better Jobs: More Density in Cities") in The New York Times.
A Home Run on Housing Regulation: Avent rightly notes that the land-use and housing regulations of metropolitan areas like San Francisco have not only driven housing prices higher, but also negatively impacted economic growth. Studies in the UK, the US and the Netherlands have demonstrated that significant restrictions on land use (called smart growth or urban containment) lead to reduced employment and economic growth in metropolitan areas. His comparison to OPEC is "right on" – that metropolitan areas like San Francisco have squeezed the supply of housing, which, of course, drives up house prices, just as restricting the supply of any good or service in demand will tend to do. Avent is also right in noting that high housing prices have driven huge numbers of people out of the San Francisco Bay Area to places like Phoenix. According to the Census Bureau, nearly 2,100,000 people moved from Los Angeles, San Francisco, San Diego and San Jose between 2000 and 2009 to other parts of the country.
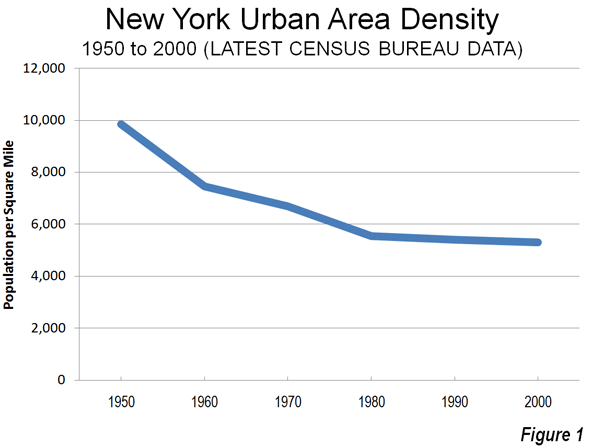
Striking Out on Density: The strikeout results from assumptions that are patently wrong. Cities (urban areas) do not get more dense as they add population. They actually become less dense. For example, the New York urban area has added 50 percent to its population since 1950, yet its population density has dropped by 45 percent (Figure 1). Between 2000 and 2010, most metropolitan population growth, whether in San Francisco, New York, Phoenix, Portland or Houston, was in the lower density suburbs (see: http://www.city-journal.org/2011/eon0406jkwc.html ). The same dispersion is occurring virtually around the world (see: http://www.demographia.com/db-evolveix.htm), from Seoul, to Shanghai, Manila and Mumbai. Rapid urban growth would mean even further dispersion and lower densities, not the higher density neighborhoods Avent imagines. Nonetheless, allowing the more affordable detached housing that people prefer would likely lead to stronger economic growth and more affluent residents in the San Francisco and other over-regulated metropolitan areas.
A "Yes, But" on Productivity: Any comparison of incomes between metropolitan areas needs to take into consideration the cost of living. For example, the San Francisco Bay Area (San Francisco/San Jose) is one of the most expensive places to live in the country. The median house price is more than 2.5 times that of Phoenix, after accounting for income differentials. Avent does not control for the difference in the cost of living, which is largely driven by the higher cost of housing. The lower cost of living neutralizes much of the impact of lower incomes (such as in Houston) in metropolitan areas like Houston, Dallas-Fort Worth, Indianapolis, etc., where the OPEC model has not been applied to land use regulation.
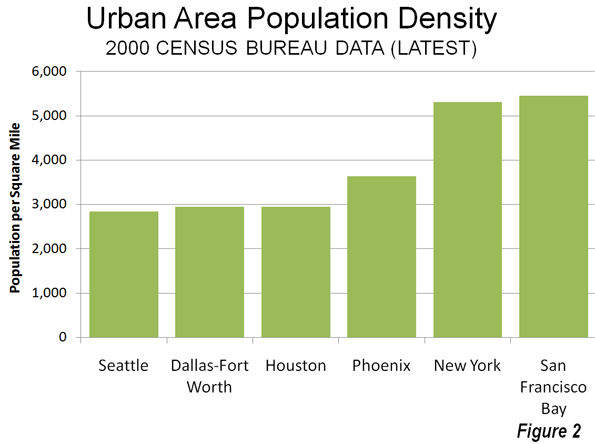
Finally, even controlling for the cost of living, there are substantial exceptions to any density-productivity thesis. For example, some of the greatest productivity gains information technology have come out of the Seattle area, which is the least dense major urban area in the 13 Western states, less dense than Houston, Dallas-Fort Worth and Phoenix. Even more impressively, Seattle's urban density is barely one-half that of New York or San Francisco (Figure 2), yet its gross domestic product per capita is higher than New York and within 2 percent of San Francisco/San Jose. Seattle's substantial contribution to the nation's productivity has occurred while its population density was declining nearly 15 percent (since 1980).
Avent, like many analysts before appears to presume that population growth means higher densities. In fact, urban areas grow by dispersing, not densifying.
The Economist magazine has called on the British government to cancel plans for the HS-2 high-speed rail line that would run from London to Birmingham and Manchester. The Economist said:
...these days politicians across the developed world hope new rapid trains, which barrel along at over 250mph (400kph), can do the same. But high-speed rail rarely delivers the widespread economic benefits its boosters predict. The British government—the latest to be beguiled by this vision of modernity—should think again
The government claims the line will cost £32 billion line, however the international experiences suggests a figure more on the order of £32 and the experience in this corridor itself suggests costs could rise even more (see The High Speed Rail Battle of Britain).
A principal purpose for the line is to bridge the economic gap between the economic dynamo of Southeast England (including London) and the Midlands and North of the country. This does not convince The Economist:
China suspended new projects after a fatal collision of two high-speed trains in July; Brazil delayed plans for a rapid Rio de Janeiro-São Paulo link, after lack of interest from construction firms. Yet governments remain susceptible to the idea that such projects can help to diminish regional inequalities and promote growth.
The Economist doubts this will happen:
In fact, in most developed economies high-speed railways fail to bridge regional divides and sometimes exacerbate them. Better connections strengthen the advantages of a rich city at the network’s hub: firms in wealthy regions can reach a bigger area, harming the prospects of poorer places. Even in Japan, home to the most commercially successful line, Tokyo continues to grow faster than Osaka. New Spanish rail lines have swelled Madrid’s business population to Seville’s loss. The trend in France has been for headquarters to move up the line to Paris and for fewer overnight stays elsewhere.
The Economist reminds the government that:
Britain still has time to ditch this grand infrastructure project—and should. Other countries should also reconsider plans to expand or introduce such lines. A good infrastructure scheme has a long life. But a bad one can derail both the public finances and a country’s development ambitions.
Finally, The Economist says that there is better use for the money.
The £32 billion at its disposal might well yield a higher return if it were spent on less glitzy schemes, such as road improvements and intra-city transport initiatives. If the aim is to regenerate “the north”, the current plan might prove a high-speed route in the wrong direction.
|


