NewGeography.com blogs
St. Louis: April 23, 2011 (9 a.m.) The St. Louis (Missouri-Illinois) metropolitan area is just beginning to dig out of the devastating tornadoes that struck on the evening of Good Friday. Miraculously, there appear to have been few, if any life-threatening injuries.
The St. Louis tornadoes, however, impacted interstate travel like no other tornadoes in history. St. Louis Lambert international Airport sustained major damage. The main terminal, lost one half of its windows and had major damage in the ticketing area. Concourse C, which is the busiest at the airport lost part of its roof, had damaged jet ways and is reported to have lost all of its windows on the north side. The main terminal would be readily recognized by movie-goers who have seen it featured in Planes, Trains and Automobiles (with an artificial snow cover in the middle of the summer) and Up in the Air. The main terminal was one of the most notable early modern terminal designs and was a precursor of the TWA terminal at JFK airport in New York.
At this point, local officials have even mentioned the possibility that the structure may have been compromised by the storm. Many cars in the adjacent parking structure were damaged by flying debris, which broke windows and produced body damage. Debris filled one of the major roadways between the main terminal and the parking structure (photograph). Needless to say, the airport has been closed indefinitely.
As disruptive as the tornado was to the airport and the traveling public, the closure is likely to be shorter in duration than if it had happened at about any other major airport in the nation. This is because St. Louis airport probably has the largest amount of unused capacity of any major airport in the western world.
The past decade has been characterized by serious reversals for St. Louis airport. The fate of the airport was significantly tied to Trans World Airlines (TWA) which established a hub at St. Louis airport in the early 1980s, shortly after the expansion of the air travel that occurred due to airline deregulation. St. Louis was one of the most convenient metropolitan areas in the nation from which to travel, with frequent nonstop service to all major markets in the nation, daily service to London and seasonal service to Paris. However, TWA filed bankruptcy more than once and was finally purchased by American Airlines. After the 911 terrorist attacks, when airline volumes dropped temporarily in the United States, American Airlines began scaling back operations at St. Louis airport. Now, the TWA – American hub is gone and the airport's largest airline is Southwest.
Over the past decade, the passenger volumes at St. Louis airport have dropped by nearly two-thirds. This has left much of the airport empty. Concourse A continues to be used near capacity. Concourse C, which used to be home to the TWA hub is probably the busiest, but is only partially used. There are two other concourses that are virtually empty including Concourse D, built when volumes were the highest and the older Concourse B. The damage to concourses appears largely to be limited to Concourse C, but it is serious. There is also a Concourse E, which is dedicated principally to Southwest Airlines. This concourse appears to have also escaped major damage.
All of this spare capacity gives St. Louis airport the potential for a quicker recovery than would be possible if the airport were running close to capacity, as was the case at the turn-of-the-century. It seems likely that this provides the opportunity to transfer operations to the nearly empty Concourses B and D, while longer-term repairs are made to Concourse C.
There is still the difficulty, however, of the damage to the main terminal, principally because it contains the ticketing and baggage facilities for Concourse A and Concourse B, which appear to still be usable. Access to these concourses could be expedited by prioritizing the repairs toward the west side of the ticketing lobby, which serves the Concourse A and Concourse B airlines and is closest to those concourses.
There still remains, however, the difficulty of handling the Concourse C flights. Even here however there may be opportunities for an expeditious recovery. Concourse E, the Southwest terminal, has direct access to Concourse D, though that access has not been permitted in recent years. There may be ways to relocate the ticket facilities for the Concourse C airlines temporarily to Concourse E, and to transfer the flights to Concourse D. Should the main terminal repairs proceed fast enough, a simpler solution would be the transfer of Concourse C traffic to Concourse D.
No final plan has been announced. It is also possible that the early damage reports are more pessimistic than will be revealed in the days and hours to come. However, even with its reduced volumes, the nation needs to have this unprecedented removal of one of its principal facilities quickly restored.
Estimates put the number of guitar players in the world at about 50 million. Something like 20 million of these pickers, strummers and shredders are Americans.
Fender®, a name synonymous with rock n’ roll dreams, was founded in Fullerton, California by Leo Fender in 1946. Recently Fender began selling the world's first guitar that is also a Rock Band 3® video game controller. According to Fender’s website, “the Squier Stratocaster blends state-of-the-art gaming and guitar technology with the authenticity of Fender design and engineering, The controller elevates the gaming experience to the level of real music making by letting users play the actual notes and chords of their favorite songs while racking up high gameplay scores.”
Aligning with the Rock Band phenomenon is not Fender’s first foray into nurturing a new generation of guitar gods wherever they might be around the world.
Fender's headquarters are in Scottsdale, Arizona with manufacturing facilities in Corona, California (USA) and Ensenada, Baja California (Mexico). To maintain and control costs over the years, Fender introduced Squier instruments in 1982, which have been produced in several nations, including Japan, Korea, India, China, Indonesia and Mexico.
The Squier brand’s main focus and most successful approach has been to be the “value brand” alternative to its big brother, Fender. Squier versions of signature models including the Stratocaster®, Telecaster®, Precision Bass® and Jazz Bass® guitars provide an official” cost-conscious alternative that has enabled successive generations of guitar players to pick up an axe at a reasonable cost. In Fender’s words, Stop Dreaming, Start Playing ™
Squier is considered the launching pad for guitar players and owners who are expected to eventually upgrade to the more expensive Fender guitars. Nonetheless, Squier has established its own fan base over the years. Oftentimes this is because the lower cost emboldens guitar player to customize their guitars in ways that might be unthinkable with their higher priced counterparts. Many famous musicians for whom price is irrelevant cling to the brand.
The world of Fender sound also includes a history of amplifiers whose distinctive tones and cabinets have defined generations of rock, jazz, country, pop and all combinations thereof.
Today many of these Fender tones are available to the masses of guitar players on the recently released AmpliTube Fender app for Apple’s iPad. Developed by IK Multimedia and Fender, the iPad app enables guitar players to use their favorite gear anytime and anywhere, including the ’65 Deluxe Reverb™, the Super-Sonic™, the ’65 Twin Reverb™, the ’59 Bassman™ LTD and the Pro Junior™.
With the AmpliTube Fender for iPad app anytime, anywhere joins stop dreaming, start playing as yet another way that Fender will continue to nurture and grow a new generation of guitar players. It will also rekindle the youthful dreams of an older generation of pickers and strummers who have now begun or are now resuming their guitar playing.
Pricing for entry-level users through global manufacturing, integrating core capabilities with the latest technologies, creating and leveraging strong brands in multiple ways for multiple generations. Fender’s formula is working and holds valuable lessons for entrepreneurs and large companies alike.
Sydney's Daily Telegraph announced on April 20 that Sydney is more dense than Mexico City, London, Los Angeles and Paris. Of course, anyone who has been to Mexico City or London knows that this is untrue and it may surprise some that Sydney is not even as dense as Los Angeles.
The article never indicates, quite for sure, what it means by Sydney, the Sydney city council area (the urban area's core local government authority, or LGA) or the Sydney urban area. Nor does the article provide an overall density, instead only indicating that there are 8,800 persons per square kilometer in "Sydney's east" and 7,900 per square kilometer in "Sydney City's west."
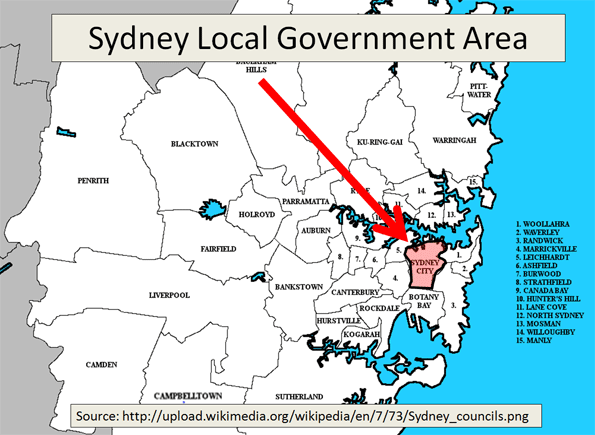
In fact, the figures are from the latest statistical local area estimates of the Australian Bureau of Statistics (ABS) for 2010, and dated March 31, 2011. A "statistical local area" is a part of an LGA (See map: Sydney Local Government Area). The statistical local areas cited by The Daily Telegraph are Sydney-East and Sydney-West, which have a combined density of 8,300 per square kilometer. The small size of the Sydney-East and Sydney-West statistical local areas is illustrated by the fact that each is about the same size as the Sydney Olympic Park.
Comparing Urban Area Densities: The Daily Telegraph's contention results from a profound misunderstanding of urban geography. The result was a comparison of urban geographies that are not comparable.
The Daily Telegraph compares the density of these two small areas of the Sydney LGA, with the urban area densities of Mexico City (which the Daily Telegraph places at 8,400), London (5,100), Los Angeles (2,750) and Paris (3,250). These figures were taken from an earlier edition of Demographia World Urban Area. (Our latest Demographia World Urban Area data, including estimated population densities for all urban areas in the world of more than 500,000 population is here). Urban areas are areas of continuous urban development.
The appropriate Sydney geography for comparison to the urban area populations of Mexico City, London, Los Angeles and Paris is the urban area (the international term), which is called the urban centre by ABS (See map: Sydney Urban Area).
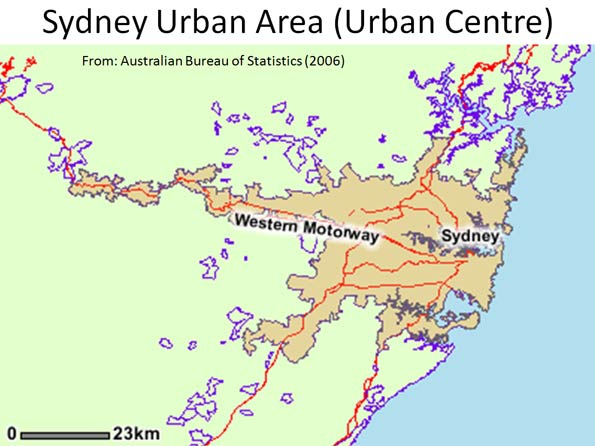
The Sydney urban centre covers an area extending south to Campbelltown, north to Palm Beach and well into the Blue Mountains on the Great Western Highway. According to the ABS, the Sydney urban area (urban centre) had a population of 3.641 million in 2006 (latest available data), and covered a land area of 1,788 square kilometers. This means that the population density of the Sydney urban area was 2,037 in 2006. Thus, the Sydney urban area has a lower density than all four international urban areas used in The Daily Telegraph comparison (Figure 1).
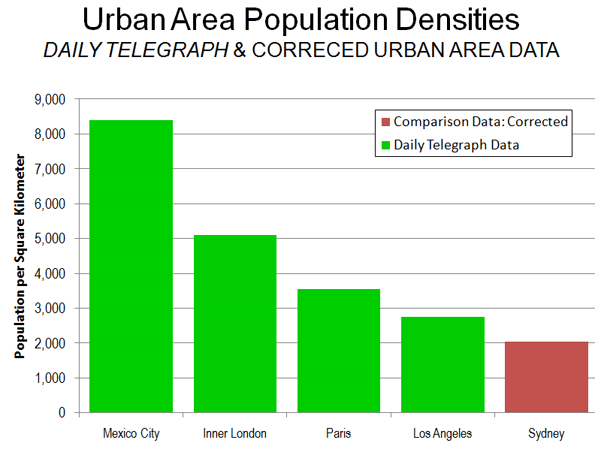
If the Sydney urban center were as dense as the Los Angeles urban area, the population would be 5 million, instead of 3.6 million. If the Sydney urban centre were as dense as the Mexico City urban area, the population would be 15 million.
Comparing Core Densities: The small area densities that The Daily Telegraph cites are also smaller than those that exist in the core areas of the cited international urban areas (Figure 2).
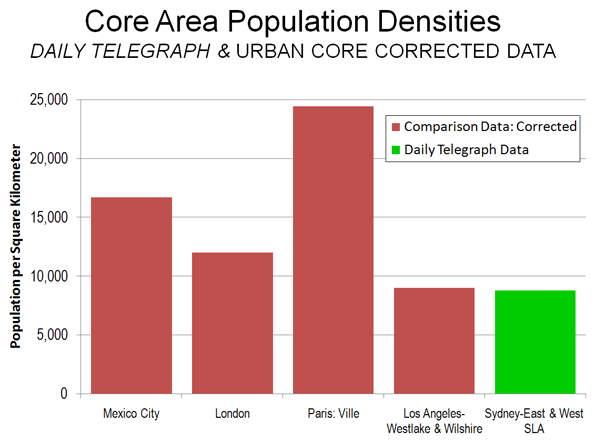
- In Mexico City, the delegation (district) of Ixtacalco has a population density double that of the Sydney-East and Sydney West statistical local areas (approximately 17,000), in an area nearly twice as large.
- The 2001 census placed the inner London borough of Kensington and Chelsea at 12,000 persons per square kilometer, in an area approximately the same size as Sydney-East and Sydney-West combined.
- The ville de Paris has a population density of more than 24,000 per square kilometer, nearly three times that of the combined Sydney-East and Sydney-West statistical local areas. The ville de Paris covers approximately eight times as much land area and smaller area densities are even higher.
- The 2000 census placed the adjacent Wilshire and Westlake Community Districts of Los Angeles at 9,000 per square kilometer. This is slightly higher than the density of the combined Sydney-East and Sydney-West statistical local areas, in an area nearly four times as large.
The Sydney urban center and statistical local area data is summarized in the table.
The Australian Population Debate: An important public policy debate is under way in Australia on the issue of population growth. As Ross Elliot indicated (Malthusian Delusions Grip Australia), some interests believe that the nation is running out of land. In fact, only 0.3 percent of Australia's land area is urban, a figure one-tenth that of the United States. The starting point for these discussions needs to be valid data and an understanding of the terms involved.
| SYDNEY URBAN CENTER & DENSE STATISTICAL LOCAL AREAS |
| Areas Cited by The Daily Telegraph |
|
|
|
|
| |
2006 Population |
Land Area (Square Kilometers) |
Density |
2010 Density |
| Sydney-East Statistical Local Area |
46,738 |
6.0 |
7,790 |
8,799 |
| Sydney-East Statistical Local Area |
38,382 |
5.7 |
6,734 |
7,852 |
| Combined |
85,120 |
11.7 |
7,275 |
8,338 |
| Share of Sydney Urban Area (Urban Centre) |
2.3% |
0.7% |
|
|
|
|
|
|
|
| Balance of Urban Area (Urban Centre) |
3,556,301 |
1,776.4 |
2,002 |
Not Available |
|
|
|
|
|
| Total Sydney Urban Area (Urban Centre) |
3,641,421 |
1,788.1 |
2,036 |
Not Available |
|
|
|
|
|
| Notes: |
|
|
|
|
| Data from Australian Bureau of Statistics |
|
|
|
|
| Urban centre data available only for census years |
|
|
|
The population of the provincial level municipality of Shanghai exceeded 22 million at the end of 2010, according to the Shanghai Population and Family Planning Commission. The population of 22.21 million exceeds the 2000 population of 16.41 million by 35 percent. This growth of nearly 6 million is more people than live in all but three Western European urban areas (Paris, London and Essen-Dusseldorf).
Virtually all of the population gain was among migrant (non-permanent) residents who lack official Shanghai registration (Shanghai Hukou status). The migrant population rose from 5.9 million to 8.1 million, an increase of 153 percent (Estimates place the number of non-permanent urban residents of China as high as 200 million). There were 14.1 million permanent residents (with Shanghai Hukou status), a seven percent increase from the 2000 figure of 13.8 million (Figure).
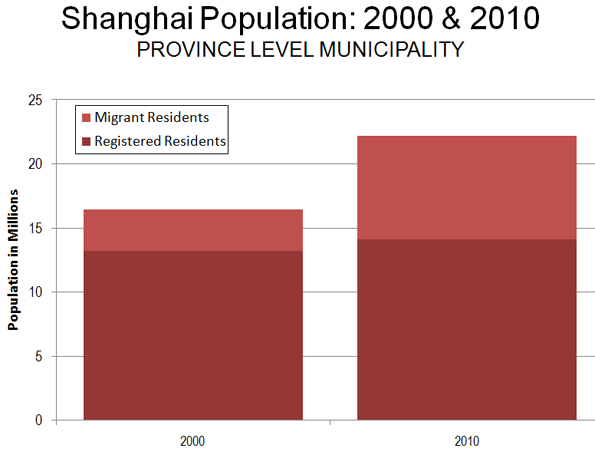
Non-permanent residents, who must have lived in Shanghai for six months to be counted, now account for 36.4 percent of the provincial level municipality's population, nearly double the 19.4 share in 2000.
Results are expected soon from the China national census, which began in November of 2010. Ding Jinhong, director of East China Normal University's School of Social Development has suggested that the census may report a population as much as 23 million, with a non-permanent resident population of 9 million.
It is estimated that the Shanghai urban area, which is wholly contained within the provincial level municipality, will have a mid-year 2011 population of 18.7 million, with a land area of 1,125 square miles (2,900 square kilometers). The Shanghai urban area, the 10th largest in the world, has a population density of 16,500 per square mile or 6,400 per square kilometer.
This urban density is more than double that of Western European urban areas with more than 500,000, however it is less than one-fourth that of the Mumbai urban area. As in Mumbai, there has been substantial population dispersion from the core to suburban areas, with only 14 percent of growth in the urban core (generally inside the inner-ring expressway) between 1982 and 2000.
The population density of the provincial municipality, which is analogous to a metropolitan area and includes considerable rural land, is much lower, at 9,100 per square mile (3,500 per square kilometer).
The week ended April 16 was particularly difficult for high speed rail, as the following events illustrate.
1. High Speed Rail Zeroed Out of US Budget: The US federal budget deal, which cut $38 billion from spending ($76 billion annualized) zeroed out the $2.5 billion 2011 budget allocation for high speed rail and $400 million of prior spending authority from President Obama's "stimulus" program, that had provided $8 billion for high speed rail in 2009. Approximately $2 billion of that authority remains and applications total $10 billion, mostly for conventional intercity rail services, rather than genuine high speed rail service.
2. Missouri Legislators Block High Speed Rail: Members of the Senate Transportation Committee in Missouri refused to place high speed rail in the annual state budget. Governor Jay Nixon is seeking more than $1 billion for intercity out of the remaining $2 billion from the original Obama Administration $8 billion program. Governor Nixon indicates that he will try to get the money placed in the budget should the US Department of Transportation award a grant. Missouri joins Florida, Wisconsin and Ohio in taking actions to block funding for high speed rail projects. This reluctance is principally the result of concerns that high speed rail will incur significant cost overruns and require operating subsidies, all of which would have to be paid for by the states, which generally face serious financial difficulties.
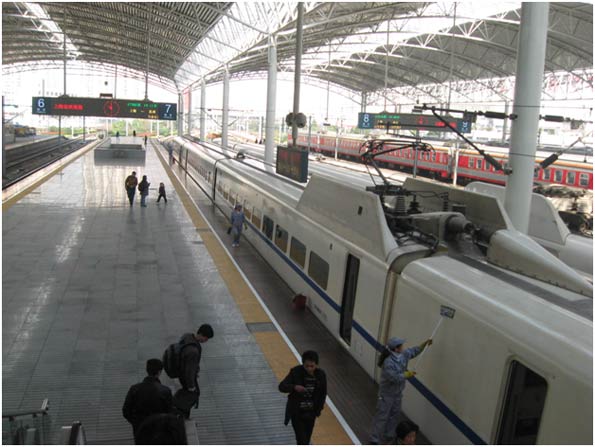
3. China Slows Down Trains: Safety, energy conservation and fare equity issues led the Ministry of Railways to announce a slow-down of its fastest trains to a maximum speed of 300 kilometers per hour (186 miles per hour). This could add materially to travel times, especially in the longer corridors being developed, which traverse the greatest distance of any in the world (such as Shanghai-Kunming, Shanghai-Beijing and Beijing-Hong Kong).
4. Opposition to Britain's HS2 Line Intensifies: Opposition continues to mount against Britain's HS2 line from London to Manchester and Leeds. Protesters showed up at a Department of Transport event at Northampton Station intended to obtain views on the government's plans. Lizzy Williams, chair of "Stop HS2" expressed concern that the government's "consultation" was not objective and told only one side of the story, ignoring the difficulties (A video of Ms. Williams at an anti-HS2 convention is here). Opposition groups also plan a rally on May 8. Finally, it was reported that projected time savings on the line have been exaggerated by the government.
|


