The big news this week is all the different tech companies announcing their moves to Texas.
The big one for Houston is the announcement that HP Enterprise is moving its HQ from Silicon Valley to Spring just north of Houston - a long-term legacy benefit of Compaq Computer (which was acquired by HP and kept substantial operations here).
“Houston is also an attractive market for us to recruit and retain talent, and a great place to do business,” Mr. Neri said, adding that as one of the largest and most diverse cities in the country, “Houston provides the opportunity over time to draw more diverse talent into our ranks.”
"Why Houston?
Houston has long been our largest U.S. employment hub, and construction has been underway since the beginning of the year on a new, state-of-the-art campus in the area. Houston is also an attractive market for us to recruit and retain talent, and a great place to do business. The most diverse city in America and the fourth largest, Houston provides the opportunity over time to draw more diverse talent into our ranks – a key priority for HPE as we work to be unconditionally inclusive.
We also anticipate long term cost savings associated with this move that we can reinvest in key areas of our business and innovation."
- And finally a repost from Facebook that digs into what that increased affordability really means for employees:
"Hewlett-Packard announced its leaving Palo Alto for Houston.
$1,100 is the average rent in Houston.
$3,350 is the average rent in Palo Alto.
Just to give a concept of how much the extra $2,250 a month that saves is.
$530 is the average monthly payment on a car.
$460 is the monthly individual cost of health insurance.
$400 is the average monthly cost of food.
$145 is the average monthly spending on gas for a car.
$130 is the average monthly cost of car insurance.
$1,665 a month total.
Those 5 things which are just as essential for people in Palo Alto as Houston and cost about as much in both places cost that much.
If an HP employee moved to Houston and cut rent cost down, but chose to save $585 more a month and put it in a 401k paying 5% for 10 years, they’d have $92,700 or 7 years average rent in Houston.
Those 5 things are also essential, so let’s just say an HP employee moved to Houston and saved the entire $2,250 a month for 10 years.
$27,000 saved a year.
$357,000 saved over 10 years.
27 years worth of rent in Houston.
9 years worth of rent in Palo Alto.
A lot of people have a lot of different reasons for companies leaving, but I think the rent factor and how it’s extremely hard for employees to live is the problem.
Hewlett-Packard was the birth of Silicon Valley and it’s leaving.
I don’t see it as unlikely a future where Facebook, Uber, Google and more could join."
Then there are the other stories on Elon Musk's and Oracle's moves to Austin:
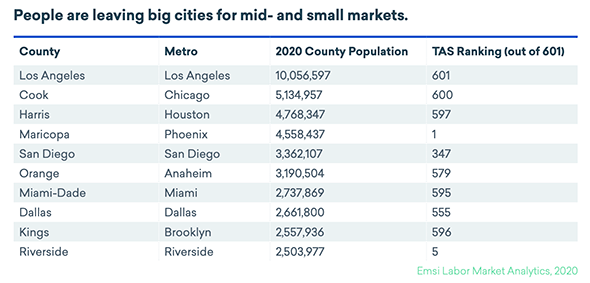
"California, with its steep housing costs, raging wildfires and strict business regulations, has been losing residents to other states, with Texas as the most popular exodus destination. Of more than 653,000 people who left California last year, about 82,000 went to Texas, more than any other state, according to census figures.
Or, as The Stanford Review wrote in a nod to the native Texan George Strait, “All of California’s Exes Are Moving to Texas.” (????) ...
California and Texas — two economic powerhouses, one led by Democrats and the other by Republicans, with respective populations of 40 million and 29 million — are in many ways natural frenemies. It is a rivalry made up of In-N-Out versus Whataburger, of Disneyland versus the State Fair of Texas, of tacos versus, well, other tacos."
"Taxes, a more affordable cost of living for employees, a lower cost of doing business, and less competition for talent are among the top drivers for the companies’ moves, though there is also a growing sense that culture is a factor, as well."
All in all a very good week for Houston and Texas! Let's hope this is just the beginning of a much larger tech exodus from California to Texas...
This piece first appeared on Houston Strategies Blogspot.
Tory Gattis is a Founding Senior Fellow with the Urban Reform Institute and co-authored the original study with noted urbanist Joel Kotkin and others, creating a city philosophy around upward social mobility for all citizens as an alternative to the popular smart growth, new urbanism, and creative class movements. He is also an editor of the Houston Strategies blog.