Few local or metropolitan issues receive more attention than housing affordability. This article provides a perspective on housing affordability. The focus is on the approach used by the Demographia International Housing Affordability Survey, which I co-author annually with Hugh Pavletich (of performanceurbanplanning.org). The Demographia Survey has been published for 14 years. This edition includes housing affordability data and ratings for nearly 300 cities (metropolitan areas) in nine nations (Note 1).
What is Housing Affordability?
Housing affordability is the relationship between housing costs and income. Affordability can only be evaluated if there is a comparison to income. Yet, analysts and journalists often use refer to house prices or rents or their increases without relation to incomes to describe housing affordability. Prices are not an indicator of affordability if they are not compared to incomes but have only anecdotal value. Nor are house price or rent trends an indicator of affordability without comparison to incomes.
What is Middle-Income Housing Affordability?
Middle-income housing affordability is important, because affordable access to quality housing has been pivotal to the democratization of prosperity that occurred in the last century in most high-income nations. Normally, the competitive market has provided middle-income housing without the need for subsidies.
Middle-income is different from low – income housing (also called "affordable housing" or “social housing”), which relies on public subsidies to serve the needs of households unable to afford the house prices or rents prevailing on the open market. Focusing on middle-income does not indicate a lesser interest in low-income housing, because subsidy eligibility requirements are tied to house prices. Better housing affordability translates into fewer households seeking housing subsidies through affordable housing programs (and less public expense).
There are two principal dimensions of middle-income housing affordability --- between housing markets and within individual market over time.
Owned and Rented Housing Affordability
Housing affordability can be measured for both owned and rented housing. Price-to-income ratios are typical for owned housing, including the “median multiple” used in the Demographia Survey (below). Percentage of incomes spent on rents are often used to evaluate rental housing affordability.
The Importance of Middle-Income Housing Affordability
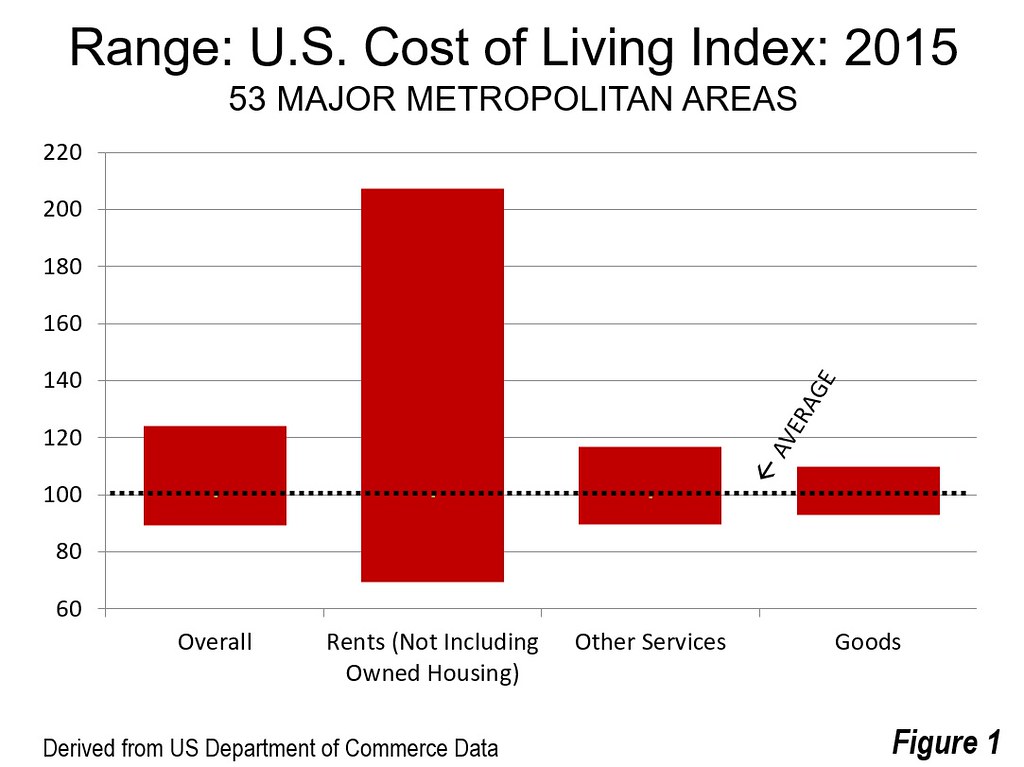
Housing is usually the largest budget item for households. The differences in housing costs between major metropolitan areas now increasingly drive differences in the costs of living. Housing costs also vary far more in their high to low range than in the other two major expenditure categories, according to the US Bureau of Economic Analysis, which are services not including rents and goods. (Figure 1).
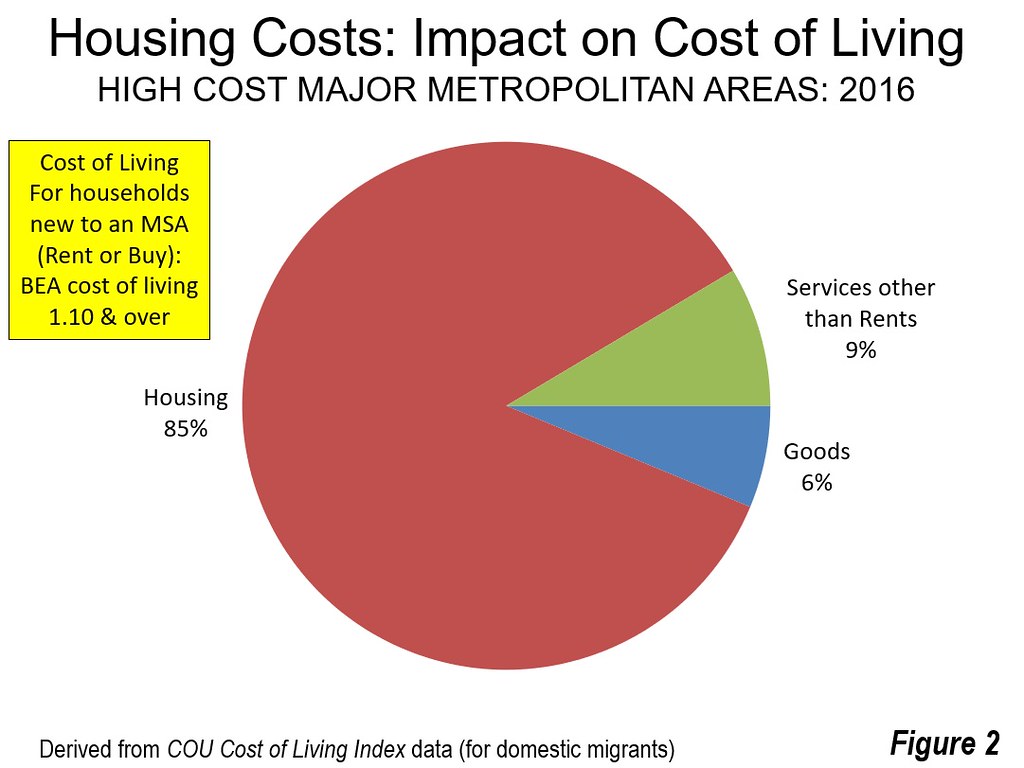
The differences are even greater when the costs of owned housing are included, as is illustrated by the COU "movers" cost of living index. This index estimates the cost of living for a domestic migrant household moving into the housing market and captures both the differences in rental and owned housing affordability. It is estimated that in the high-cost markets, 85 percent of the higher cost of living stems from higher housing costs (Figure 2).
Middle-income housing affordability is also important to the economy. Paul Cheshire of the London School of Economics and Wouter Vermeulen of VU University wrote, "... [h]ousing being the dominant asset in most households’ portfolios, there are also repercussions on saving, investment and consumption choices.” Where housing is more affordable, households will have more discretionary income to purchase additional goods and services and to save (which generates investment). All of this can contribute to job creation and a stronger economy.
Not only do higher house prices lead to a lower standard of living, but can also increase poverty. For example, California has the highest housing cost adjusted poverty rate among the 50 states of the United States, at 20.4%. This compares to California's 14.5% rate without adjustment for housing costs.


Owned Housing Affordability Metrics
One of the most utilized owned housing affordability metrics is the price-to-income ratio. A United Nations publication indicated:
"If there is a single indicator that conveys the greatest amount of information on the overall performance of housing markets, it is the house price-to-income ratio. It is obviously a key measure of housing affordability. When housing prices are high relative to incomes, other things being equal, a smaller fraction of the population will be able to purchase housing."
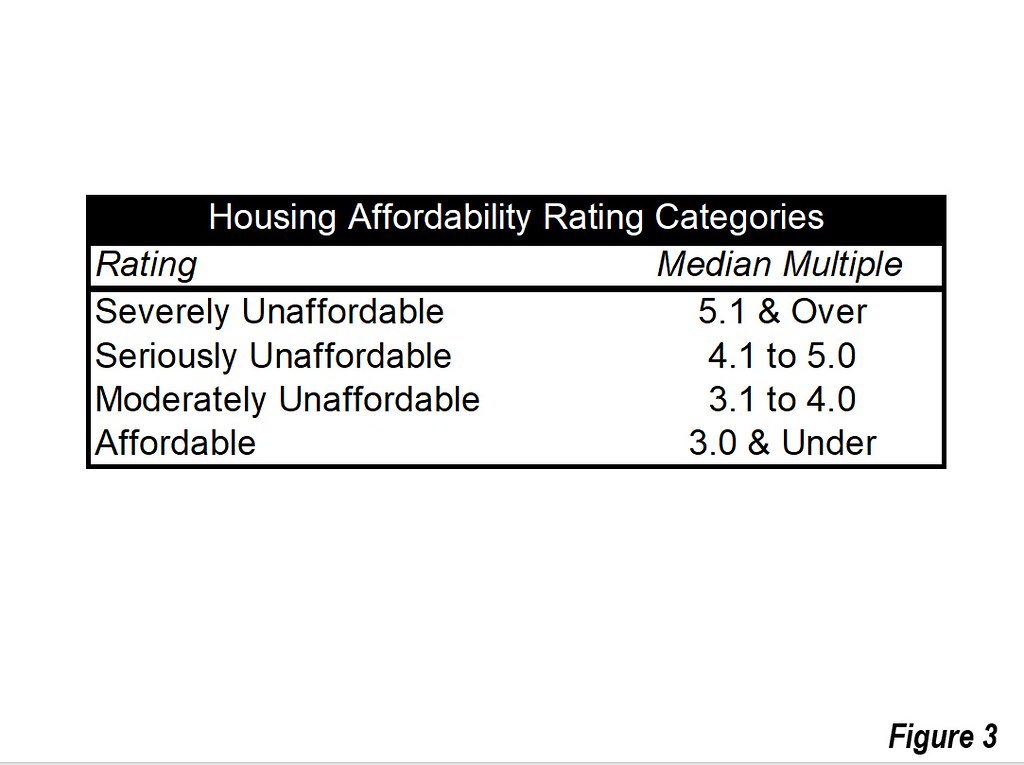
The Demographia International Housing Affordability Survey uses the median multiple (median house price divided by median household income). The evaluation criteria is in Figure 3.

The Geography of Housing Affordability
Demographia evaluates housing affordability between housing markets: Housing markets are coterminous with labor markets (metropolitan areas).Within housing markets, there will typically be a large urban area, which is defined an expanse of contiguous built-up land (see Demographia World Urban Areas). The area beyond the urban periphery is defined as the urban fringe, which is generally the land between the principal urban area and the boundaries of the metropolitan area. Typically, the urban fringe contains virtually all of the greenfield (undeveloped) land that can be used for new housing. Much of the growth of urban areas that has occurred since World War II in Australia, Canada, New Zealand, and the United States has been in detached housing tracts in greenfield areas.
Thus, for example, the New York housing market includes the entire New York metropolitan area, which stretches from Montauk Point on Long Island (east) to Pike County, Pennsylvania (west) to Ocean County, New Jersey (south) and to Dutchess County (north). The city of New York and other municipalities are only parts of the New York housing market.
Housing affordability may also be evaluated within a housing market. For example, the housing affordability in Brooklyn can be compared to that of White Plains. Or, housing affordability can be compared between more local neighborhoods, like Rainier Valley and Ballard in Seattle. Demographia evaluates housing affordability only at the housing market level and thus does not evaluate housing affordability between areas within housing markets.
The Time Dimension of Housing Affordability
The other important housing affordability comparison is historical, or over time. Thus, housing affordability may be compared for the same or multiple housing markets between 2000 and 2017.
The Need for Clarity
As many cities evaluated by Demographia suffer severe housing affordability, evaluations need to be conducted with sufficient clarity. Serious housing affordability evaluation requires comparison that includes incomes, as well as comparisons between housing markets and over time. In fact, much of the nation remains affordable by historic standards --- severe unaffordability is limited to a minority of markets. The public is misled by analyses that fail to include both prices and incomes (See related article: "Housing Affordability from Vancouver to Sydney and Toronto: Time to Do What Works").
Note 1: Metropolitan areas are "economic cities," generally not related to the physical jurisdictions of cities as local government authorities, which may be larger or smaller than metropolitan areas.
Note 2: Parts of this article are adapted from published materials I have authored or co-authored.
Wendell Cox is principal of Demographia, an international public policy and demographics firm. He is a Senior Fellow of the Center for Opportunity Urbanism (US), Senior Fellow for Housing Affordability and Municipal Policy for the Frontier Centre for Public Policy (Canada), and a member of the Board of Advisors of the Center for Demographics and Policy at Chapman University (California). He is co-author of the "Demographia International Housing Affordability Survey" and author of "Demographia World Urban Areas" and "War on the Dream: How Anti-Sprawl Policy Threatens the Quality of Life." He was appointed to three terms on the Los Angeles County Transportation Commission, where he served with the leading city and county leadership as the only non-elected member. He served as a visiting professor at the Conservatoire National des Arts et Metiers, a national university in Paris.
Photograph: Exurban Charlotte, NC-SC (by author)


