NewGeography.com blogs
The Vancouver Olympic Village scandal continues to worsen. During construction, the City of Vancouver was forced to take over financing of the project, as the developer’s initial lender backed out due to cost overruns. At the end of last August, the developer fell behind its payment schedule, and the City placed the property into receivership in November. The development has been a spectacular failure, with fewer than half of the 737 units being sold. The outstanding debt to the city is $743 million. To make things worse, a quarter of the tenants are now suing the City.
One might expect that a billion dollar development for Olympic athletes would be pretty posh. Prices ranged from $530,900 for a 566 square foot studio, to $4.8 million for three bedroom units. Even in unaffordable Vancouver, you’d expect that to come with a bedroom big enough to fit a bed. According to tenants, they didn’t even get that. What they did get was bizarre leaks, cracking ceilings, and inadequate heating. The project sounds like something out of Arrested Development, or as the tenants’ legal counsel put it, “It’s like they were sold a BMW and they got a broken Toyota. And even if they manage to fix everything, it’s still a Toyota.” The units are far from the luxury accommodations buyers were lead to believe they were getting.
In short, the lawsuits seem perfectly legitimate, and are likely to cost the City another $50 million dollars. It’s also hard to imagine this quagmire will help the value of the units on the market. Even before the horrendous conditions of the condo units were made public, reports claimed that the development was worth $150-200 million less than what was owed to the city. It is hard to imagine a scenario where the city isn’t stuck with hundreds of millions of dollars of losses.
Of course, none of this should come as a surprise. Government housing projects generally fail. And if governments can’t build adequate housing for the poor, it’s hard to imagine them building upscale housing at a price that the market will bear. Hence the shoddy work. The lesson here is a simple one, that history proves again and again: governments make bad landlords.
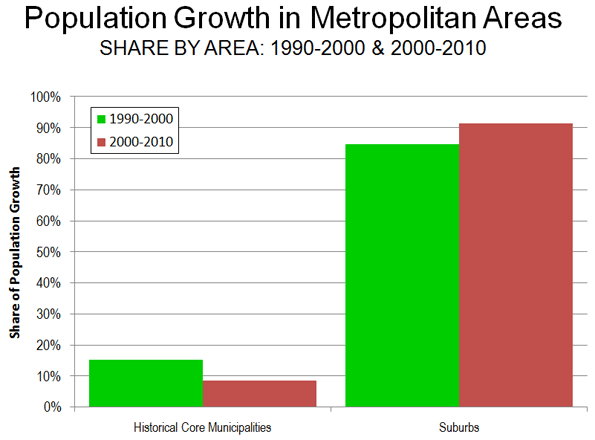
Based upon complete census counts for 2010, historical core municipalities of the nation’s major metropolitan areas (over 1,000,000 population) captured a smaller share of growth in the 2000s than in the 1990s.
The results for the 50 metropolitan areas (New Orleans excluded due to Hurricane Katrina and Tucson unexpectedly failed to reach 1,000,000 population) indicate that historical core municipalities accounted for 9 percent of metropolitan area growth between 2000 and 2010, compared to 15 percent in the 1990-2000 period. Overall, suburban areas captured 91 percent of metropolitan area population growth between 2000 and 2010, compared to 85 percent between 1990 and 2000.
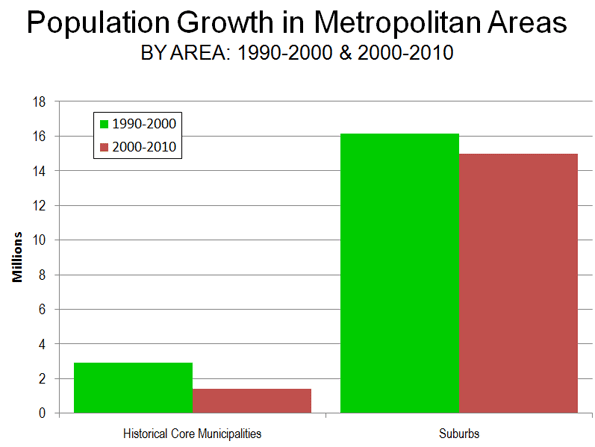
Total population growth in the historical core municipalities was 1.4 million, nearly all of it in municipalities with a largely suburban form (such as Phoenix, San Antonio and Charlotte). This compares to an increase of 2.9 million during the 1990s.
Suburban areas (areas in metropolitan areas outside the historical core municipalities) grew 15.0 million, down from 16.1million.
Overall, the major metropolitan areas added 14 percent to their populations in the 2000s, down from 19 percent growth in the 1990s. The historical core municipalities grew 4 percent, compared to the 1990s rate of 7 percent. Suburban areas grew 18 percent, compared to the 1990s rate of 26 percent (all data unweighted).
There are only 9 cities in the United States with populations over 1 million. The list includes New York, Los Angeles, San Diego, Philadelphia, Chicago, Phoenix, Houston, San Antonio, and Dallas. With this afternoon’s release of Census 2010 numbers for New York City, the final 2010 data is in.
Of these 1 million or more cities, only Chicago lost population over the last decade, yet the media seems to be in love with Mayor Daley. The New Yorker called Mayor Daley “America’s most successful mayor.” Newsweek is equally “impressed” with Daley’s performance, saying “Daley also leaves behind a glittering metropolis that Chicagoans rightly love and outsiders can only envy.”
Chicago’s 200,000 person loss shows Mayor Daley’s failed legacy as Mayor. Daley leaves office with a smaller population than when he took office in 1989. Numbers are stubborn things. There was no Chicago comeback of the middle class to experience bad public schools, high taxes, and corruption. Almost no one predicted Philadelphia would gain population while Chicago declined. Mayor Daley’s legacy appears to be built on smoke and mirrors. A fawning media of urban reporters puffed up Daley for years. According to the numbers, Mayor Daley is America’s worst Mayor leaving Rahm Emanuel with intractable problems. Is it more accurate to call Mayor Daley the white man’s Coleman Young?
Just released census counts for 2010 show the New York metropolitan area historical core municipality, the city of New York, to have gained in population from 8,009,000 in 2000 to 8,175,000 in 2010, an increase of 2.1 percent. This is the highest census count ever achieved by the city of New York.
Nonetheless, the figure was 245,000 below the expected level of 8,420,000 (based upon 2010 Census Bureau estimates). The higher population estimate had been the result of challenges by the city to Census Bureau intercensal estimates. The city of New York attracted 29 percent of the metropolitan area growth. Approximately 43 percent of the metropolitan area’s population lives in the city.
Overall, the New York metropolitan area grew from 18,323,000 to 18,890,000, an increase of 3.1 percent. The suburbs grew approximately twice as rapidly as the city of New York, at 4.0 percent, and attracted 71 percent of the metropolitan area growth.
According to US Census Bureau data, the Charlotte (NC-SC) metropolitan area grew 32 percent, from 1,330,000 to 1,758,000 between 2000 and 2010. The historical core municipality, the city of Charlotte grew from a 2000 base of 568,000 to 731,000 in 2010 (an increase of 29 percent). The city of Charlotte is largely of a post-World War II suburban form. The city of Charlotte attracted 38 percent of the metropolitan area growth.
The suburbs grew at a 35 percent rate, higher than that of the city of Charlotte. The suburbs captured 62 percent of the metropolitan area growth.
The Providence (RI) metropolitan area was one of the slowest growing in the 2000 to 2010 period, according to counts just released by the Census Bureau. Providence grew 1.1 percent, from 1,583,000 to 1,601,000. The historical core municipality, the city of Providence gained 2.5 percent, from 174,000 to 178,000 and grew faster than the suburbs, like neighboring Boston. The city of Providence reached its population peak in 1940, at 254,000.
Even so, the suburbs attracted 75 percent of the metropolitan area growth.
What defines the American Dream? A new poll by Big Builder reveals that one answer to this enduring question may be home ownership. A major portion of the American population (59%) believes that they are living the American Dream. Respondents distinguished owning a home as the second most important factor of the American Dream, just behind raising a family.
Another statistic in this poll seem to suggest that this trend may be more stifled as the younger generation of Americans (18-29 year olds) come to the crucial decision of buying a home. Still, 49% see home ownership as a “sound investment,” while 49% of this age group call it “too risky.” Perhaps the effect of the weak economy has been especially evident in this age group.
Some interesting contradictions also arise in these statistics. For instance, 58% of those who believe the housing crisis is a chronic problem also recommend buying a home. Furthermore, 75% of respondents claim to not have benefited from any federal program to assist in ownership (such as mortgage interest deduction), yet 71% confessed to taking the deduction. The pollsters have considered that perhaps the government’s assistance in home ownership may be unclear for many Americans.
A final statistic worth mentioning is that 58% of Americans believe that fulfilling the American Dream is influenced mostly by their own skills and hard work than by the current state of the economy. The ubiquitous American Dream still runs on hard work and the pressing notion of owning a home, it would seem.
The historical core municipality of the Detroit metropolitan area, the city of Detroit, continued its steep population decline between 2000 and 2010. The new census count indicates that the city dropped to 733,000 residents, from 951,000 in 2000. This drop of 25 percent was the largest in any census period since 1950, when the city peaked at a population of 1,850,000. Even so, the percentage decline from 1950 of 61.4 percent remains less than that of city of St. Louis, which has experienced the steepest population decline of any municipality that has reached 500,000 population in modern times (62.7 percent).
The decline did not extend to the suburbs, which gained a modest 2.3 percent between 2000 and 2010. Suburban growth has also been substantial since 1950, with 2.2 million new residents added.
However, the suburban growth was not enough to erase the impact of the city of Detroit decline. The Detroit metropolitan area fell from 4,452,000 in 2000 to 4,296,000 in 2010, a loss of 3.6 percent. The loss was the greatest among major metropolitan areas reporting up to this time. Nonetheless, even with the huge city of Detroit loss, the Detroit metropolitan area has grown more than 30 percent and more than 1,000,000 people.
The new 2010 census results for the Boston metropolitan area show the historical core municipality, the city of Boston, increasing its population at a greater rate than that of its suburbs. Thus far, Boston is the only historical core municipality with essentially the same boundaries as in 1950 that has experienced a growth rate greater than the suburbs in the 2000 to 2010 period. Boston grew from 589,000 to 617,000, an increase of 4.8 percent. Even so, the city remained more than 20 percent below its historic peak of 801,000 in 1950. Further, even with its faster growth, the city of Boston captured only 18 percent of the metropolitan area growth between 2000 and 2010. The city of Boston contains 14 percent of the metropolitan area population.
By comparison, the suburbs grew 3.5 percent and accounted for 82 percent of the metropolitan area growth.
Overall, the Boston metropolitan area, which stretches from Massachusetts into New Hampshire grew from 4,391,000 to 4,552,000, for a growth rate of 3.7 percent, approximately one-third of the national growth rate between 2000 and 2010. This growth rate is the same as in Los Angeles and Milwaukee, which were the slowest growing major metropolitan areas (population over 1,000,000) reporting so far, with the exception of Cleveland, Detroit and Pittsburgh, which lost population.
Boston retains its position as the nation’s 10th largest metropolitan area, having passed losing Detroit and been passed by Atlanta.
The historical core municipality of the Cincinnati metropolitan area, the city of Cincinnati, continued its population loss string stretching back to the 1970 census and dropped below 300,000 population for the first time since the 1890 census. The city peaked at 504,000 in 1950.
In 2010, the census counted 297,000 residents, down 10 percent from the 2000 figure of 331,000. The city of Cincinnati has essentially the same borders (city limits) as in 1950. Hamilton County, which is the core county and includes the city of Cincinnati lost 43,000 people, with a net loss of 9,000 in the portions outside the city.
All growth was in the suburbs, which grew at a rate of 9 percent. The fastest growing counties were Boone in Kentucky at 38 percent and Warren in Ohio at 34 percent. Combined, these two counties captured more than two-thirds of the metropolitan area growth.
The Cincinnati metropolitan area, which stretches from Ohio into Kentucky and Indiana grew 6 percent, from 2,010,000 to 2,130,000.
|


