NewGeography.com blogs

Another Congressional Cut for High Speed Rail

July 15: Today there was another indication that the newly constituted House of Representatives understands the “litmus test” imperative of zeroing out high speed rail appropriations, in light of potentially required cuts in essential programs like Medicare, Social Security and others. $1 billion was switched to Midwest flood relief in an approval today of the Energy and Water Appropriations bill for the 2012 budget.

The bill may or may not pass the Senate and lobbying is underway to “obligate” the money before the rescission becomes law. Either way, this action and the previous action to reduce high speed rail funding by $2.5 billion in a previous budget deal with the White House indicates a very tough road ahead for the Administration’s high speed rail program, most of which is not genuine high speed rail.

The rescission would block funding that has been promised by the US Department of Transportation to a number of projects around the nation, such in California, North Carolina, Michigan, Missouri and Illinois.

Infographic: State Property Tax Data

Credit Sesame has created an interactive map showing property tax rates for all 50 states. Based on data from the Tax Foundation, the graphic also shows property tax rates as a share of home value and as a share of median income of homeowners. It's important to note that property taxes can vary regionally within states, and property taxes are only one part of overall state and local tax burden.


Mortgages – CreditSesame.com

Here's the Tax Foundation's numbers on overall state and local tax burden. For more on overall state business climates, check out our Enterprising States report.

Infographic: Which Industries Are Growing in Your State?

EMSI teamed up with Tableau Software to create this industry data display. You can visualize every broad-level (2-digit NAICS) industry by state over the last decade. Also, click on the dot for each state to see the trends for each sector. The bigger the dot, the more jobs that state has in the selected industry. It may take a few seconds to load.

A few observations:

1. Right off the bat, you can see the explosive growth of the mining sector nationally over the past few years. If you scroll to mining and oil exploration in the dropdown or isolate it by clicking on the chart, you can see Texas has by far the largest number of jobs among all states. We covered this sector and specific oil and gas extraction occupations in depth recently.

2. One of the cool things to do is scroll through each year to see the changing complexion of employment. There’s widespread growth projected for most states in 2011, with a few exceptions, but clicking back through the past few years shows a much different picture.

3. Another intriguing sector is manufacturing. In the last decade, it hasn’t fared well. That much is clear. But notice the tide start to shift in 2010, with Indiana and Michigan showing slight growth. And in 2011, nearly three-quarters of the US is expected to see job expansion.

More Hyperbole on Ghost Cities in China

The so-called Chinese "Ghost Cities" have been the subject of a number of articles in recent months. There appears to be some truth in the reports, such as in the building of a near empty new city in Inner Mongolia (Ordos). There is also a good deal of hyperbole.

A recent article ran in the Business Insider, entitled "New Satellite Pictures of China's Ghost Cities," which relied principally on satellite images, some quite old. Somewhat more proximate (as on-the-ground")  pictures are provided and linked in this article. They show that at least two of the Ghosts have risen from the dead (or they may never have been dead at all).

Changsha, Hunan: Changsha is the rapidly growing capital of Hunan province, adding nearly 50 percent to its urban districts between 2000 and 2010 (even greater growth than in the US growth leaders, Las Vegas and Raleigh). The Business Insider article displays a satellite image showing huge areas of construction both to the northeast and to the west of the urban area.

When planning a 2009 trip to China, I chose to visit Changsha because of the extensive construction shown in this very same satellite image. In my continuing satellite image research on urban areas, especially relating to  Demographia World Urban Areas, I noted that this appeared to be the most extensive construction in the nation. A number of photographs are included inour Changsha Rental Car Tour,  which were taken in September 2009.

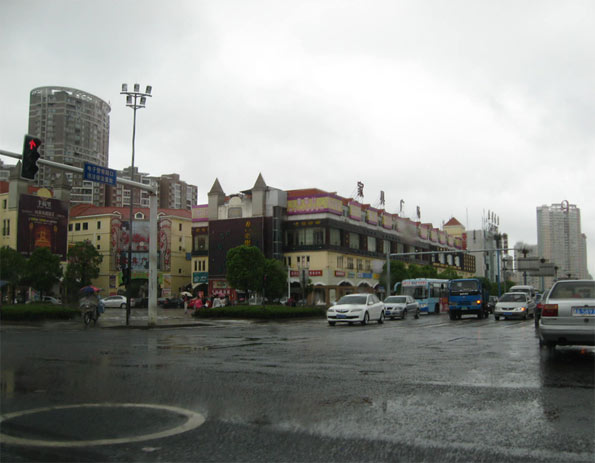
On a rainy and quiet Sunday afternoon I took a tour of the northeast construction area and found that much of the construction had been finished. Moreover it was obvious from both the traffic and the open shopping centers and shops that this was anything but a "ghost city" (see photograph, above).

The next day I took a similar trip to the western construction area. As in the northeast, much of the construction was complete and the communities were alive.

Zhengzhou, Henan: Zhengzhou is also rapidly growing even faster than Changsha (over 60 percent in 10 years) and is the capital of Henan province. The article displays multiple satellite images of the Zhengzhou New Area. Because of a previous article in the Daily Mail, I took the opportunity on a recent trip to visit the Zhengzhou New Area and file a report. The Zhengzhou New Area is alive.

The Business Insider also indicates an unfamiliarity with Chinese geography.

Outside Jiangsu? A couple of the photographs referred to empty developments as being "outside Jiangsu," as a Westerner might describe a development as being outside Phoenix or Omaha. However Jiangsu is not an urban area or city, it is a province. Thus, to refer to a development as being outside Jiangsu is akin to referring to a development as being outside Arizona or Nebraska.

Changsha Already Twice as Large as Los Angeles? The Business Insider also advises us that Changsha is already twice as big as Los Angeles. In fact, there are no comparable geographies between Los Angeles and Changsha that could make such a statement even close to accurate. Regrettably, many writers and much of the press make comparisons between China and other nations without the remotest idea of the meaning of the geographical terms they are using. Here are a couple of ways that Los Angeles and Changsha can be compared.

1. Central municipality: The central municipality or core city of the Los Angeles area is the city of Los Angeles. It has a population of approximately 3.8 million people, but accounts for less than one third of the population of either the metropolitan area (functional area or labor market area) or the urban area (physical area or area of continuous development). Strictly speaking, there are no central municipalities in China, because the regions or prefectures are themselves municipalities. It is as if the city of Los Angeles comprised both Los Angeles and Orange counties. Chinese municipalities are divided into districts and if a comparison were to be made at the central municipality level, Changsha's central district would have to be used. This would be the district (qu) of Furong, which has a population of 500,000 people, about 1/8 that of the city of Los Angeles.

Core city comparisons are fraught with difficulties. This is illustrated by Melbourne, which had little more than 70,000 people in the last Australian census, approximately two percent of the metropolitan population. The 2010 US Census showed Melbourne, Florida to be larger.

2. Urban Area: The one level at which they valid comparison could be made is the urban area, or the area of continuous urban development. The latest data for Los Angeles (2000) indicates an urban area population of 11.7 million people. The 2010 US Census counts for the Los Angeles area suggest that the urban area total, once released will be little higher than the 2000 figure.

Based upon the 2010 census data, the next edition of Demographia World Urban Areas will estimate the Changsha urban area at approximately 3,000,000 people. Thus, by the urban area metric, Changsha has a population approximately one-quarter that of Los Angeles.

It is possible that Business Insider like others, compared the population of the central city of Los Angeles (3.8 million), which is only part of the urban area to that of the Changsha municipality (7 million), which has more than double the population of the Changsha urban area and covers at least 25 times as much land area (virtually all it rural). They are not the same thing.

-----

Photograph: In the northwestern Changsha "ghost city:" September 2009 (by author)

Which Modes are “Multi-Modal” & Enhance Mobility?

One thing that makes Smart Growth appealing is its language.  Terms like “livability” and “transit-oriented development” sound engaging, and “smart” growth is, frankly, self-flattering for its acolytes.  On transportation matters, advocates rarely declare their intent to reduce roadway capacity and divert money to transit projects (along with other auto unfriendly policies).  Instead, they say they are pursuing a “multi-modal” strategy to promote “transportation choice.”

But what are acceptable modes in a multi-modal strategy?  And do all choices equal greater mobility?

In Boston, some enterprising businesses have been renting out Segways – those futuristic, gyro-balanced transporters.  Tourists find them easy to ride and extremely convenient for scooting around the historic landmarks on the city’s wide sidewalks.  But residents see them as a nuisance, so the 13-member Boston City Council has voted unanimously to ban them from city sidewalks.

The Segway is certainly another mode of travel.  Shouldn’t the Boston City Council, which promotes multi-modal transportation, embrace the Segway?

Those favoring the ban don’t necessarily want the Segways to disappear from the city.  They want to move them onto roads where tourists unfamiliar with Boston’s road network can jostle with hurried commuters in 4,000 pound cars and even heavier buses and commuter rail cars.

Like cars, Segways provide motorized transport for individuals, and its self-balancing upright design makes it more compact and maneuverable than a bicycle or moped and, thus, more suitable to mix with pedestrians on the sidewalk.  And like roads, sidewalks are inherently multi-modal and can accommodate more than just foot traffic.

When planners and progressive politicians bark the virtues of “multi-modal” and “transportation choice,” they are usually just pushing taxes and subsidies for mass transit, especially rail transit.  Unfortunately, clever rhetoric too often trumps critical thinking.

For example, light rail transit is considered by many to be the apogee of an urban transportation system, but replacing existing bus lines with rail lines does not necessarily enhance mobility but simply substitutes one form of collective transport for another.

Furthermore, in most communities the only mobility choices people have are private transport (automobiles) or public mass transport (buses or rail).  Expanding transportation choices would mean introducing private competition for mass transit services and public support, such as mobility vouchers for low income people, for private transport (e.g., Zipcars or taxis).

As cities continue to face bleak budget forecasts, the costs of different travel modes will remain an important consideration.  Because mobility is intricately tied to economic prosperity, it’s equally important to understand which modes enhance mobility and which ones merely give it lip service.

Ed Braddy is the director of the American Dream Coalition, a non-profit organization promoting freedom, mobility and affordable homeownership.  He can be reached at 352-281-5817 or at ed@americandreamcoalition.org.

Adjusting to Fiscal and Political Realities in Transportation Funding

As this is written, we do not know the exact level of funding the House Transportation and Infrastructure Committee will propose in its draft legislation, to be unveiled in the first week of July and marked up the following week. Nor do we know what level of funding the Senate Finance Committee will come up with. But we do know that both Houses will be obliged to propose far less funding than is contained in the current (FY 2010) surface transportation budget of $52 billion ($41 billion for highways, $11 billion for transit). What will be the practical consequences of this belt tightening?

The proposition that the Federal Government "must learn to live within its means" has become the fiscal conservatives’ article of faith and an elliptical way of stating the Republican opposition to deficit financing. This principle has found its way into the House T&I Committee’s "Views and Estimates for Fiscal Year 2012" report and it has been reaffirmed in countless statements and briefings by congressional sources.

The practical implications of this policy for the federal-aid surface transportation program are unambiguous: federal budget authority in FY 2012 and beyond will be limited to the tax receipts flowing into the Highway Trust Fund. Those revenues (plus interest) will amount to an estimated $36.9 billion in 2011, according to the Congressional Budget Office (CBO)— $31.8 billion to be credited to the Highway Account and $5.1 billion to the Transit Account. Over the next ten years, CBO estimates these revenues will grow at an average rate of a little more than one percent per year, largely reflecting expected growth in motor fuel consumption. ("The Highway Trust Fund and Paying for Highways," testimony of Joseph Kile, Asst. Director of CBO, before the Senate Finance Committee, May 17, 2011).

Thus, over a six-year period, 2012-2017, tax receipts credited to the Highway Trust Fund (plus interest) could be expected to amount to approximately $230 billion— about the same sum as was authorized in the 5-year SAFETEA-LU authorization ($238.5 billion).

Limiting future budget authority to tax revenues flowing into the Highway Trust Fund will cause a significant drop from the current funding level. However, current spending has been inflated by a massive injection of stimulus funds from the American Recovery and Reinvestment Act of 2009— a total of $48 billion ($27.5 billion for highways, $6.8 billion for transit and $8 billion for high-speed rail). The stimulus almost doubled the annual amount of funding available  for transportation, making baseline comparisons misleading. A more accurate measure would be to compare the expected FY 2012 funding with pre-stimulus funding levels. In this comparison, the highway program would suffer a drop of 17% — from an average of $38.6 billion/year during SAFETEA-LU (FY 2005-2009) to $32 billion/year in FY 2012.  Adding the uncommitted HTF funds remaining in the Highway Account at the end of Fiscal Year 2011  ($14.8 billion, CBO estimate) would enable the annual highway allocation to be raised to about $34 billion/year — a drop of only 12 percent from the SAFETEA-LU level). (SAFETEA-LU data obtained from www.fhwa.dot.gov/safetealu/safetea-lu_authorizations.pdf,  4/6/2006),

Such reductions, while not insignificant, would not be catastrophic. The cut in spending  authority could be absorbed by streamlining and narrowing the scope of the federal-aid program. Its primary mission would need to be refocused on traditional "core" highway and transit programs and on keeping existing transportation assets in a state of good repair. Discretionary awards such as the TIGER and high-speed rail grants would have to be eliminated. Proposals for major infrastructure spending (through the proposed Infrastructure Bank) would have to be dropped. So would programs that are deemed of little national significance or that do not serve the national need — such as various "transportation enhancements," set-asides, and "livability" projects that cater to narrow constituencies. Most of these Trust Fund "hitchikers," as Sen. James Inhofe calls them, will have to be handed off to state and local governments.

Will states and local governments be willing and able to pick up the slack? Some will, others may not. Many states and localities have been willing to approve significant transportation improvement programs– provided the objectives are clearly spelled out. In fact, voters approved 77 percent of local transportation ballot measures in 2010, according to the Center for Transportation Excellence.

While the above prospect may sound alarming when set against the current inflated spending levels, distorted by the stimulus spike, many fiscal conservatives view the new fiscal environment as an opportunity to return the federal-aid program to its original roots. Greater spending discipline, they hope, will refocus the federal mission on national interests and legitimate federal objectives, restore the program’s lost meaning and sense of purpose and give states and localities more voice and responsibility in managing their transportation future. With more constrained funding, certain hard-to-attain objectives such as greater emphasis on asset preservation, expanded use of highway pricing and tolling and higher levels of  private investment, will become a greater imperative and more achievable.

Let us also not forget that the federal contribution constitutes only about 25% of the nation's total surface transportation budget (40% of the capital budget). The rest is provided by state and local governments. The nation would still be spending more than $150 billion/year to preserve and improve our highways, bridges and transit systems— $50 billion short of the level recommended by the National Transportation Policy and Revenue Commission, but still a respectable level of funding.

What about major new infrastructure investments? Undoubtedly, they will be necessary in the longer run because of the need to replace aging facilities and to accommodate future growth in population. But major capital expenditures can be, and will have to be, deferred until the recession has ended, the economy has started growing again and the federal budget deficit has been brought under control. At that more distant moment in time, perhaps toward the end of this decade, the nation might be able to resume investing in new infrastructure and embark on a new series of "bold endeavors" — major capital additions to the nation’s highways and rail systems. For now, prudence, good judgment and the compelling need to rein in the budget deficit, dictate that government should live within its means. And that means spending no more than what we pay into the Trust Fund.

Blight Envy - How Development Works in LA

I never thought I’d say this, but I think I want to live in a blighted neighborhood. Well, actually, a community redevelopment area (CRA). They used to be one and the same, but no longer. Apparently you have to live or do business in a redevelopment area to get any “love” in Los Angeles … love being when the government takes your tax dollars and gives them to someone else no more needy.

Let me explain.

The City Council of Los Angeles just approved a program to loan CRA money to businesses in the Hollywood redevelopment area, which extends from Franklin Avenue south to Santa Monica Boulevard. If borrowers meet certain conditions, loans for storefront improvements never have to be paid back … wow, free money!

As a card-carrying member of the Los Angeles Area Chamber of Commerce, I certainly don’t begrudge businesses financial support to help improve their prospects, including the streetscape, when the whole community benefits.

But let’s be real: Many parts of the Hollywood redevelopment area, which includes the Hollywood & Highland complex, Sunset + Vine and the Roosevelt Hotel, are no more blighted than any other part of the city.

That includes my neighborhood council district, which lies south of the designated redevelopment area and encompasses Melrose Avenue, West Third Street and Wilshire Boulevard on the Miracle Mile. But there’s no money for our businesses. Or businesses on West Pico Boulevard. Or businesses on Van Nuys Boulevard. We are chopped liver.

There is a place for redevelopment, to be sure, but this program illustrates exactly why the CRA has so many critics. In this case, the problem isn’t the program — storefront improvement loans are a great idea. The problem is in the execution. This should be a citywide program, with funds shared among all Council districts in Los Angeles and doled out based on objective criteria.

It’s time to rethink redevelopment.

Cary Brazeman, a former executive with CB Richard Ellis in Los Angeles, is a neighborhood council member and founder of LA Neighbors United. Contact him through www.LAneighbors.org

Exaggerating in Orlando: Sunrail

For decades taxpayers have paid billions to finance major transportation project cost overruns far exceeding the routinely low-ball forecasts available at approval time. This has been documented in a wide body of academic literature, the most important of which was conducted by Bent Flyvbjerg of Oxford University, Nils Bruzelius University of Stockholm and Werner Rothengatter of the University of Karlsruhe in Germany (Megaprojects and Risk: An Anatomy of Ambition).

Major project advocacy, however, has descended to a new low of unprecedented and absurd exaggeration. This is evident in the current public policy debate about the Sunrail commuter rail project in Orlando. Two examples make the point

Exaggeration #1: Job Creation: The Central Florida Partnership claims that Sunrail will create 10,000  jobs. "almost immediately." This would be quite an accomplishment. The Sunrail project is currently projected to cost approximately $850 million for just the first segment. Every cent of the likely cost overruns will be on a blank check drawn the account of Florida taxpayers.

At Sunrail's claimed rate of job creation,  the Obama Administration's $800 million "shovel ready" stimulus program (enacted in 2009), would have "almost immediately" produced more than nine million jobs. By now, the unemployment rate would have been reduced to little above 2 percent, lower than at any point in the more than 60 years of available data. Of course, and predictably, the stimulus program did no such thing, not least because a job created by public spending is likely to destroy more than one sustainable job in the private sector.

Exaggeration #2: Sunrail Will Make a Difference: The proponents imply that Sunrail will carry a significant number of trips in the Orlando area, claiming that the line will carry one lane of freeway traffic and that it will give central Florida residents an alternative to high gasoline prices. In fact, even if Sun Rail reaches its ridership projections, it would take a full day of train travel to remove less than an hour's peak hour freeway volume. Needless to say, no one will notice any fewer cars on the freeway (Figure).

Further, Sunrail will not provide an alternative to the overwhelming majority of central Floridians, since it will attract only 1,850 new round-trip riders per day by 2030 (Sunrail's number). Spending $850 million on Sunrail is the same as the taxpayers giving each new rider a gift of $450,000.

The Need to Set Rational Priorities: All of this is occurring in the face of an national fiscal crisis so severe that even the AARP has expressed its willingness to consider cuts to Social Security. As an AARP spokesperson put it "You have to look at all the tradeoffs." Indeed.

High Speed Rail Subsidies in Iowa: Nothing for Something

The Federal government is again offering money it does not have to entice a state (Iowa) to spend money that it does not have on something it does not need. The state of Iowa is being asked to provide funds to match federal funding for a so-called "high speed rail" line from Chicago to Iowa City. The new rail line would simply duplicate service that is already available. Luxury intercity bus service is provided between Iowa City and Chicago twice daily. The luxury buses are equipped with plugs for laptop computers and with free wireless high-speed internet service. Perhaps most surprisingly, the luxury buses make the trip faster than the so-called high speed rail line, at 3:50 hours. The trains would take more than an hour longer (5:00 hours). No one would be able to get to Chicago quicker than now. Only in America does anyone call a train that averages 45 miles per hour "high speed rail."

The state would be required to provide $20 million in subsidies to buy trains and then more to operate the trains, making up the substantial difference between costs and passenger fares. This is despite a fare much higher than the bus fare, likely to be at least $50 (based upon current fares for similar distances). By contrast, the luxury bus service charges a fare of $18.00, and does not require a penny of taxpayer subsidy. Because the luxury bus is commercially viable (read "sustainable"), service can readily be added and funded by passengers. Adding rail service would require even more in subsidies from Iowa. The bus is also more environmentally friendly than the train.

Further, this funding would be just the first step of a faux-high speed rail plan that envisions new intercity trains from Chicago across Iowa to Omaha. In the long run, this could cost the state hundreds of millions, if not billions of dollars. Already, a similar line from St. Louis to Chicago has escalated in cost nearly 10 times, after adjustment for inflation, from under $400 million to $4 billion.

Unplanned cost overruns are the rule, rather than the exception in rail projects. European researchers Bent Flyvbjerg, Nils Bruzelius and Werner Rottengather (Megaprojects and Risk: An Anatomy of Ambition) and others have shown that new rail projects routinely cost more than planned (Note 1).

Flyvbjerg et al found that the average rail project cost 45 percent more than projected and that 80 percent cost overruns were not unusual. Cost overruns were found to occur in 9 of 10 projects. Further, they found that ridership and passenger fares also often fell short of projections, increasing the need for operating subsidies.

Iowa legislators may well identify ways to spend their scarce tax funding on services that are actually needed.

______

Note: Flyvbjerg is a professor at Oxford University in the United Kingdom. Bruzelius is an associate professor at the University of Stockholm. Rothengatter is head of the Institute of Economic Policy and Research at the University of Karlsruhe in Germany and has served as president of the World Conference on Transport Research Society (WCTRS), which is perhaps the largest and most prestigious international association of transport academics and professionals.

Biking in Minneapolis

The sustainable biking craze seems to keep rolling as more and more cities encourage commuters and wanderers to bike across town instead of drive. New programs, such as Nice Ride in Minneapolis, offer an innovative service where one can rent out a bike for a small fee and ride it across town to other stations, or continue to hold onto the bike and continue making payments.

Other cities are turning their spokes with similar programs: B-Cycle in Denver, a program in D.C., and Bixi in Montreal all have enough riders to sustain the businesses. While profit from these bikes may be viable, the question of sustainability and more improved quality of life still remains.

The way Nice Ride functions is endearingly simple: one signs up for a fixed subscription (with discounts for university students) and receives a special key that can be used at any Nice Ride station. The user slips in the key, and unlocks a bike. The bike can then be ridden across town to any station in the city, any time from April to November. In June 2010 when Nice Ride began, this simple plan garnered 10,000 trips in in its first month of use. So has this new model (and increased biking in general) for urban transportation provided any gains for the public other than fatigued legs?

It seems that the program is a perfect fit for the city’s infrastructure. The city already has 46 miles of on-street bike lanes and 84 miles of bike trails to support such a project. On top of this, the city’s bicycle culture is one of the strongest in the nation, second only to Portland, whose more temperate climate has an edge for those cyclists hoping to commute regularly.

Something that both cities have experienced is a drop in bicycle/motor vehicle crashes as more and more people decide to utilize biking as their main source of transportation. This “safety in numbers” concept has potentially attracted more and more cyclists each year leading to not only a wider understanding of the bicycle culture present, but safer roads as respect is paid to the cyclists braving the busy roads of Minneapolis and St. Paul as well.

The biking craze in the Twin Cities has also lead to the area being one of the cleanest cities in the world according to an article featured in Forbes. The research examined many different facets of a city’s infrastructure, including the emphasis the city places upon transportation, including biking. The article cites the city’s extensive use of bike lanes (as well as its transit and bus systems) as the major reason the Minneapolis/St. Paul area is so clean. The Twin Cities ranked fifth on the list, behind the likes of Calgary, Honolulu, Helsinki, and Ottawa.

So while other cities may stick to the classic emphasis on automobiles, Minneapolis has shown that biking is not only a safe mode of transportation, but one that can help to clean up the urban environment as well. Not to mention the cult cycling craze that many biking cities possess seemingly unifies an active demographic into a hopeful mode for future American transportation.